
Fold-change forest plot
Arguments
- result
A
cr_result, a list ofcr_results (fromcr_test_all()), or a precomputed data frame with columnstreatment,median_log2_fc.
See also
cr_plot_forest() for effect sizes with confidence intervals.
Other visualisation:
cr_plot_comparison(),
cr_plot_dose_response(),
cr_plot_effect_sizes(),
cr_plot_heatmap(),
cr_plot_histogram(),
cr_plot_intensity(),
cr_plot_plate(),
cr_plot_qc(),
cr_plot_roc(),
cr_plot_scatter(),
cr_plot_spatial(),
cr_plot_timeline()
Examples
# \donttest{
exp <- cr_example_experiment(seed = 1, n_cells_per_well = 20)
res <- cr_test_all(exp, "marker_1", "Untreated", level = "replicate")
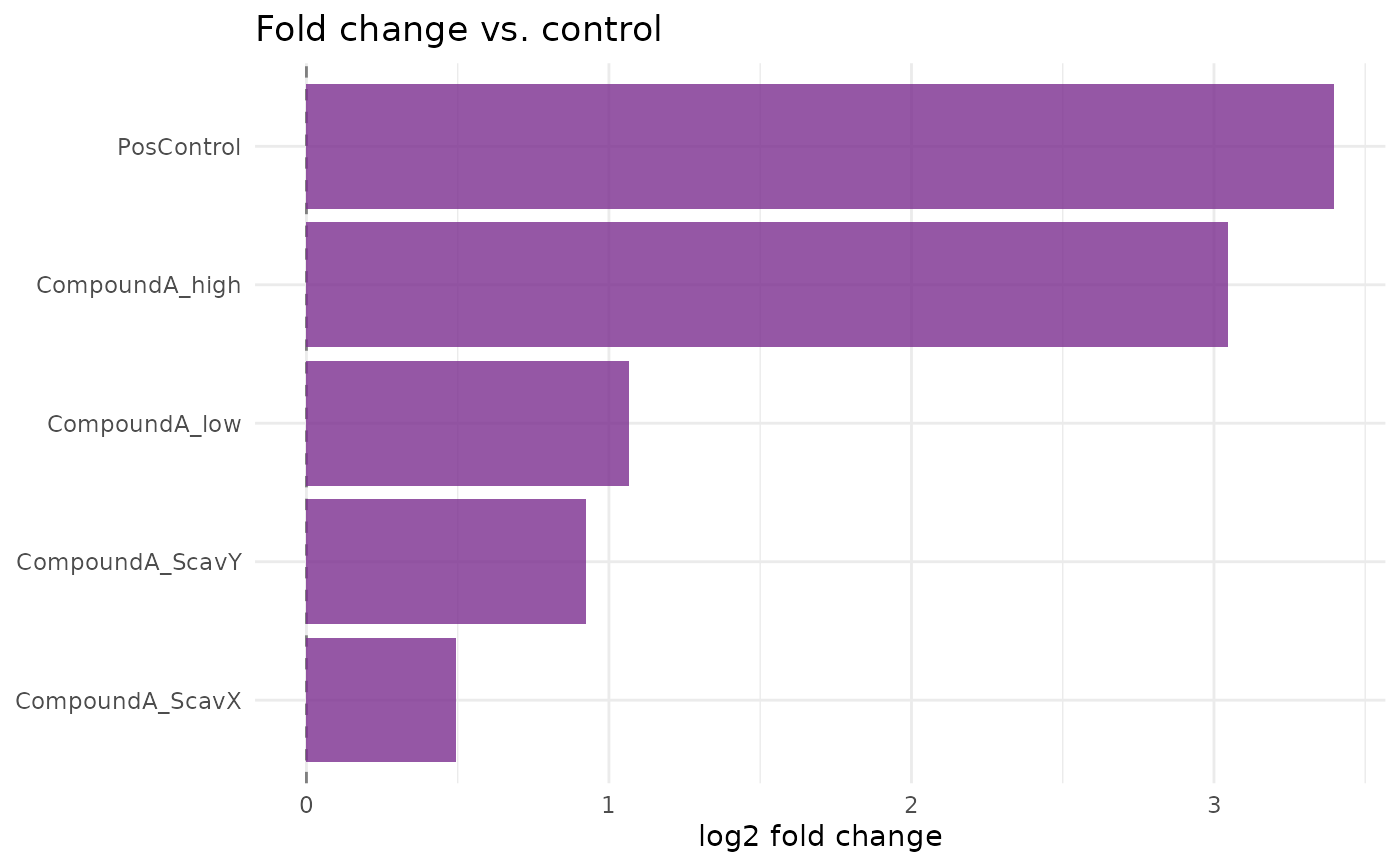
cr_plot_foldchange(res)
 # }
# }