
ROC curve plot
Examples
exp <- cr_example_experiment(seed = 1, n_cells_per_well = 30)
res <- cr_logistic(exp, "marker_1", "CompoundA_high", "Untreated")
cr_plot_roc(res)
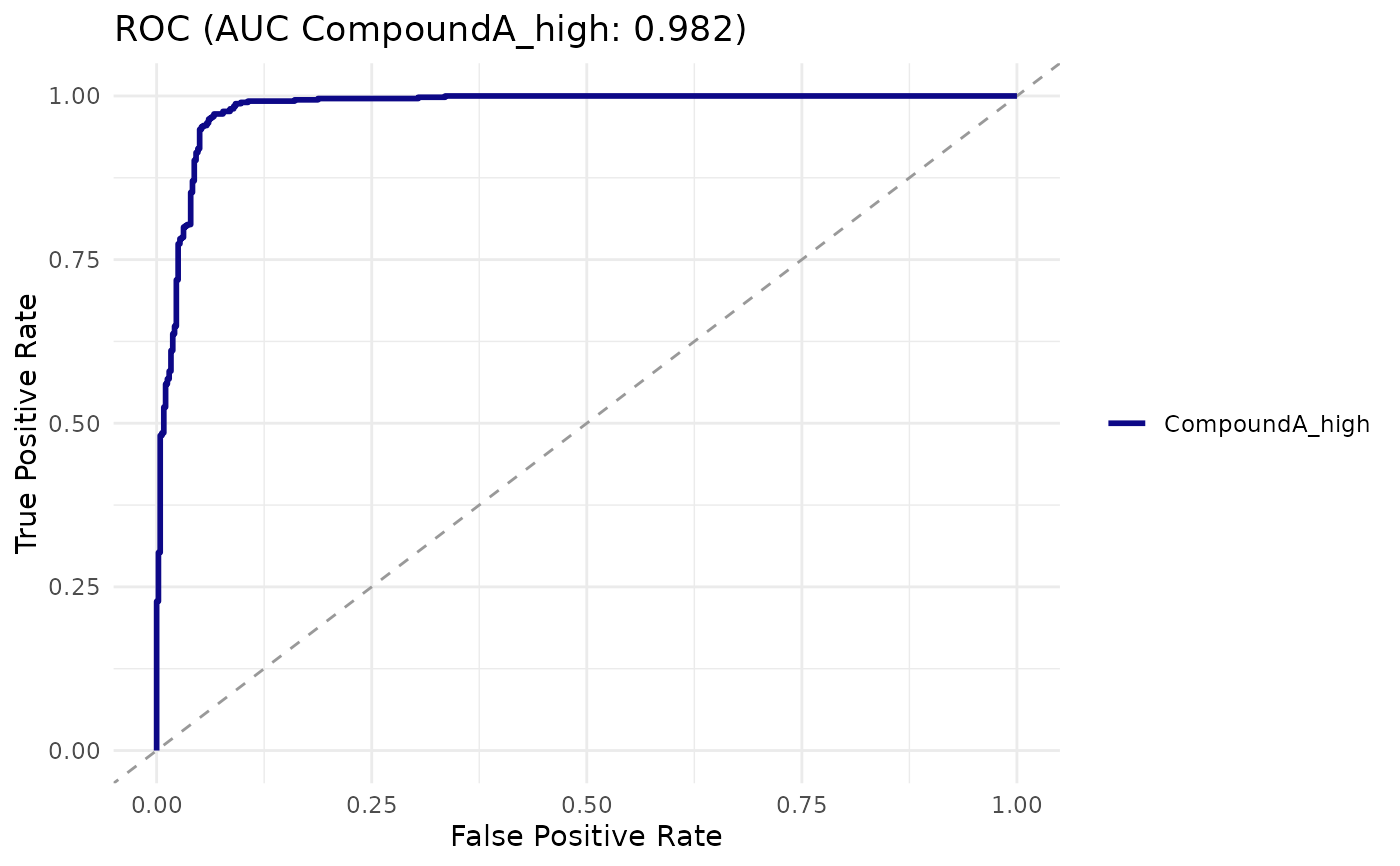
ROC curve plot
exp <- cr_example_experiment(seed = 1, n_cells_per_well = 30)
res <- cr_logistic(exp, "marker_1", "CompoundA_high", "Untreated")
cr_plot_roc(res)