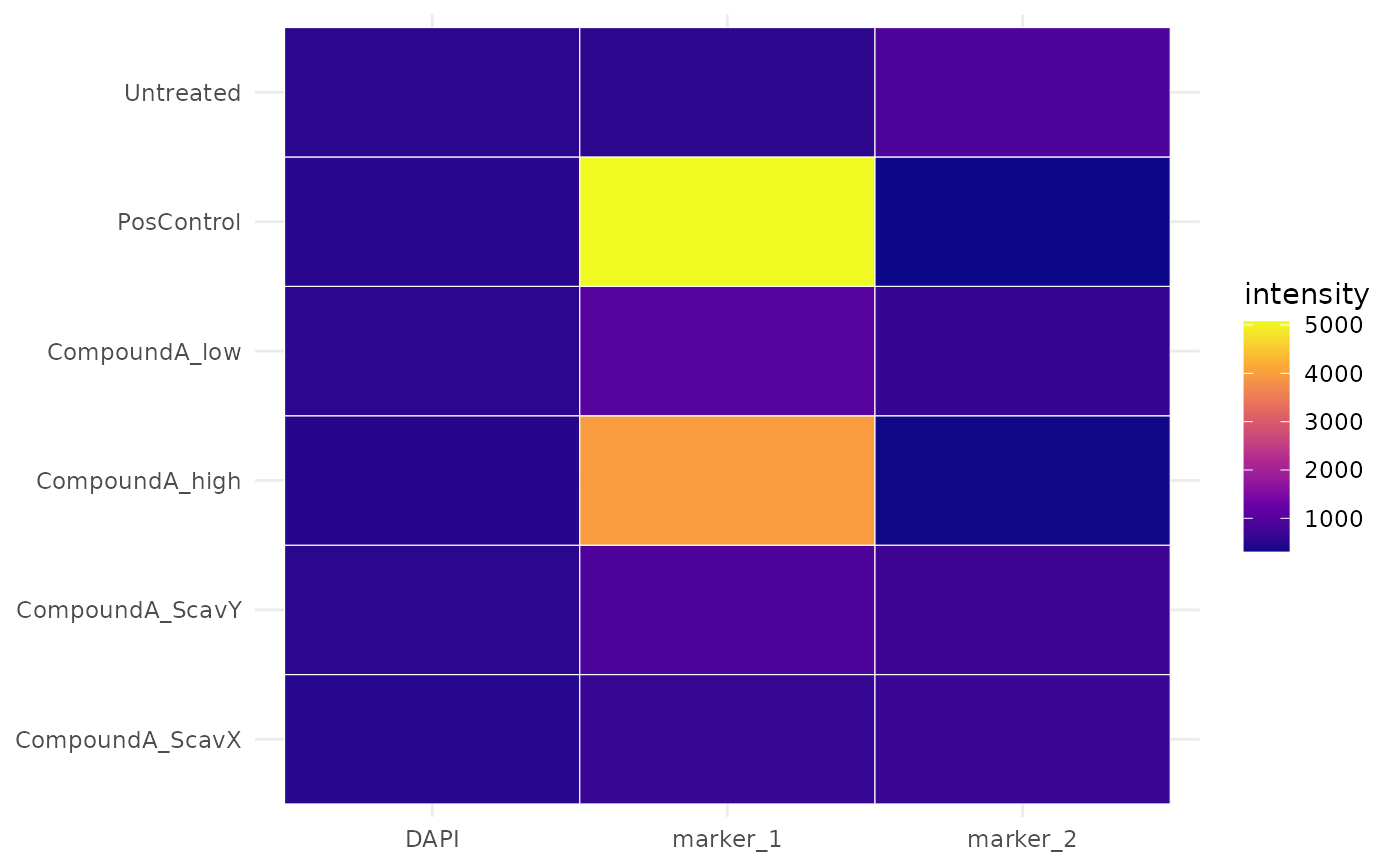
Heatmap of channel medians across groups
Usage
cr_plot_heatmap(
  experiment,
  channels,
  group_by = "treatment",
  scale = c("none", "row", "column")
)
Arguments
- experiment
A cr_experiment.
- channels
Character vector of channel names.
- group_by
Design column defining rows. Default
"treatment".
- scale
One of "none", "row", "column". Scaling centres the
values, so the fill switches from the sequential to the diverging
palette.
See also
Other visualisation:
cr_plot_comparison(),
cr_plot_dose_response(),
cr_plot_effect_sizes(),
cr_plot_foldchange(),
cr_plot_histogram(),
cr_plot_intensity(),
cr_plot_plate(),
cr_plot_qc(),
cr_plot_roc(),
cr_plot_scatter(),
cr_plot_spatial(),
cr_plot_timeline()
Examples
exp <- cr_example_experiment(seed = 1, n_cells_per_well = 30)
cr_plot_heatmap(exp, c("DAPI", "marker_1", "marker_2"))