
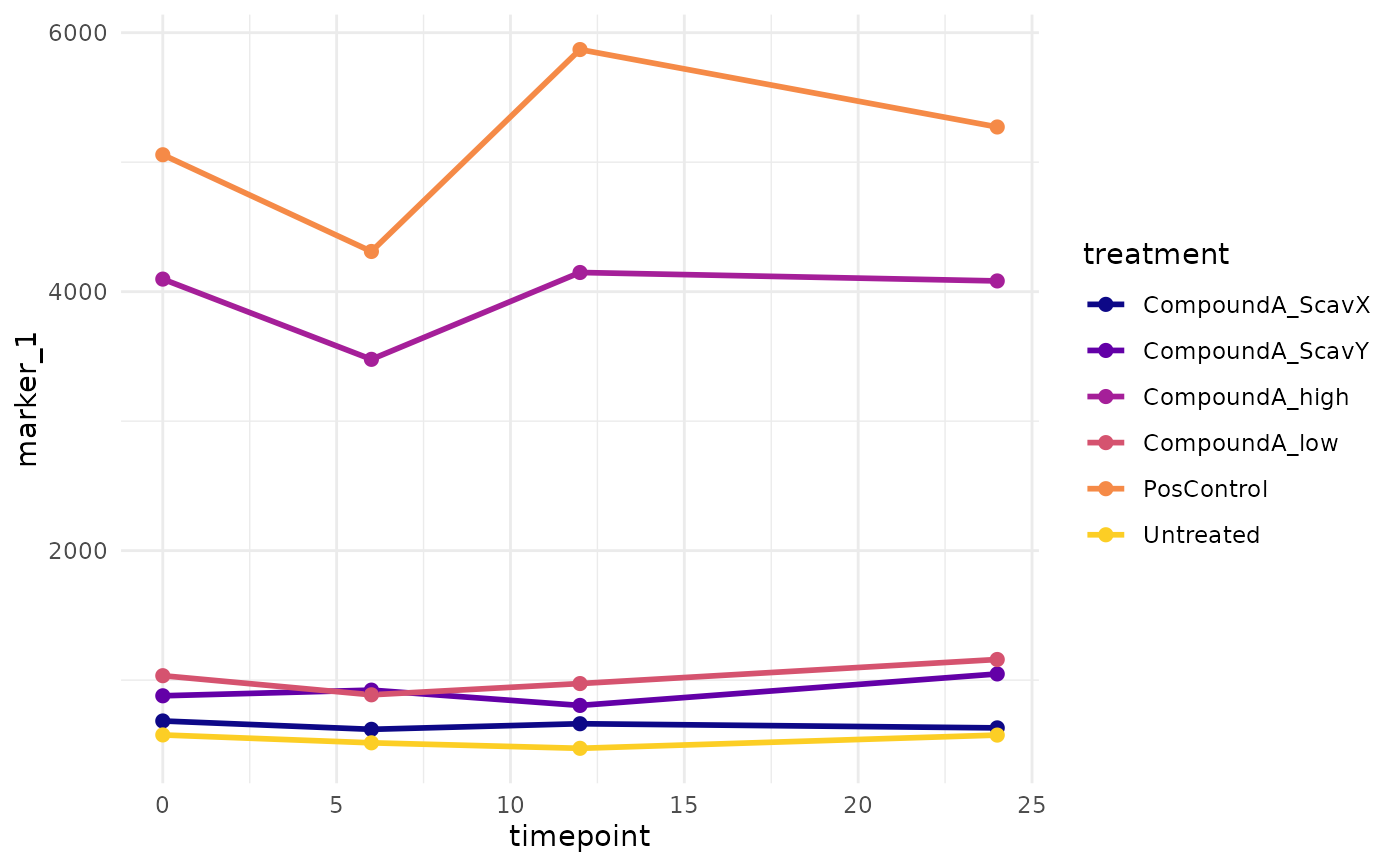
Time-course line plot
Examples
exp <- cr_example_experiment(seed = 1, n_cells_per_well = 30)
exp$design$timepoint <- rep(c(0, 6, 12, 24), length.out = nrow(exp$design))
cr_plot_timeline(exp, "timepoint", "marker_1")
Time-course line plot
exp <- cr_example_experiment(seed = 1, n_cells_per_well = 30)
exp$design$timepoint <- rep(c(0, 6, 12, 24), length.out = nrow(exp$design))
cr_plot_timeline(exp, "timepoint", "marker_1")