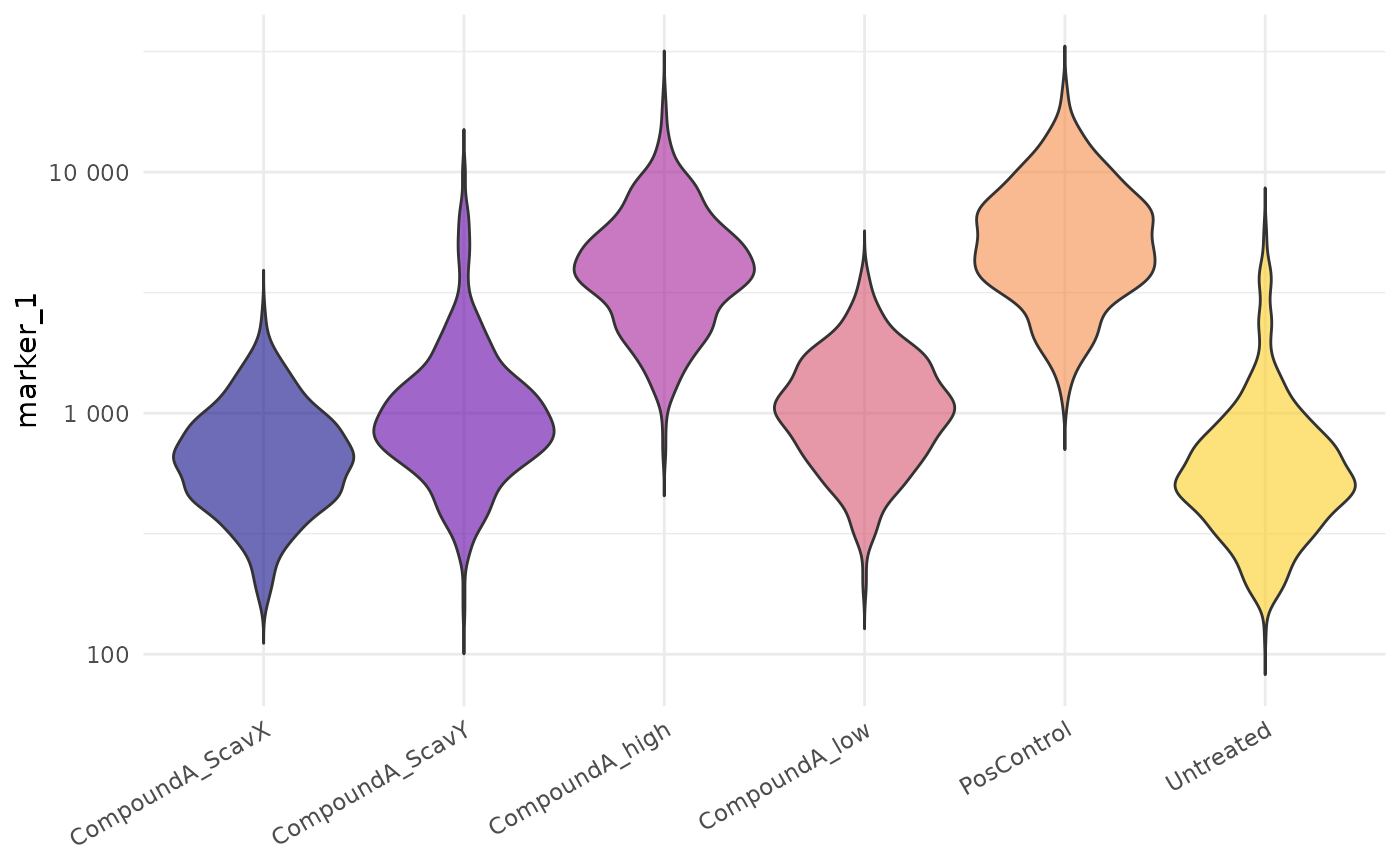
Intensity distributions by group
Usage
cr_plot_intensity(
  experiment,
  channel,
  group_by = "treatment",
  geom = c("violin", "boxplot", "both"),
  log_y = TRUE
)See also
cr_plot_screen() to overlay the unit of replication.
Other visualisation:
cr_plot_comparison(),
cr_plot_dose_response(),
cr_plot_effect_sizes(),
cr_plot_foldchange(),
cr_plot_heatmap(),
cr_plot_histogram(),
cr_plot_plate(),
cr_plot_qc(),
cr_plot_roc(),
cr_plot_scatter(),
cr_plot_spatial(),
cr_plot_timeline()
Examples
exp <- cr_example_experiment(seed = 1, n_cells_per_well = 30)
cr_plot_intensity(exp, channel = "marker_1")