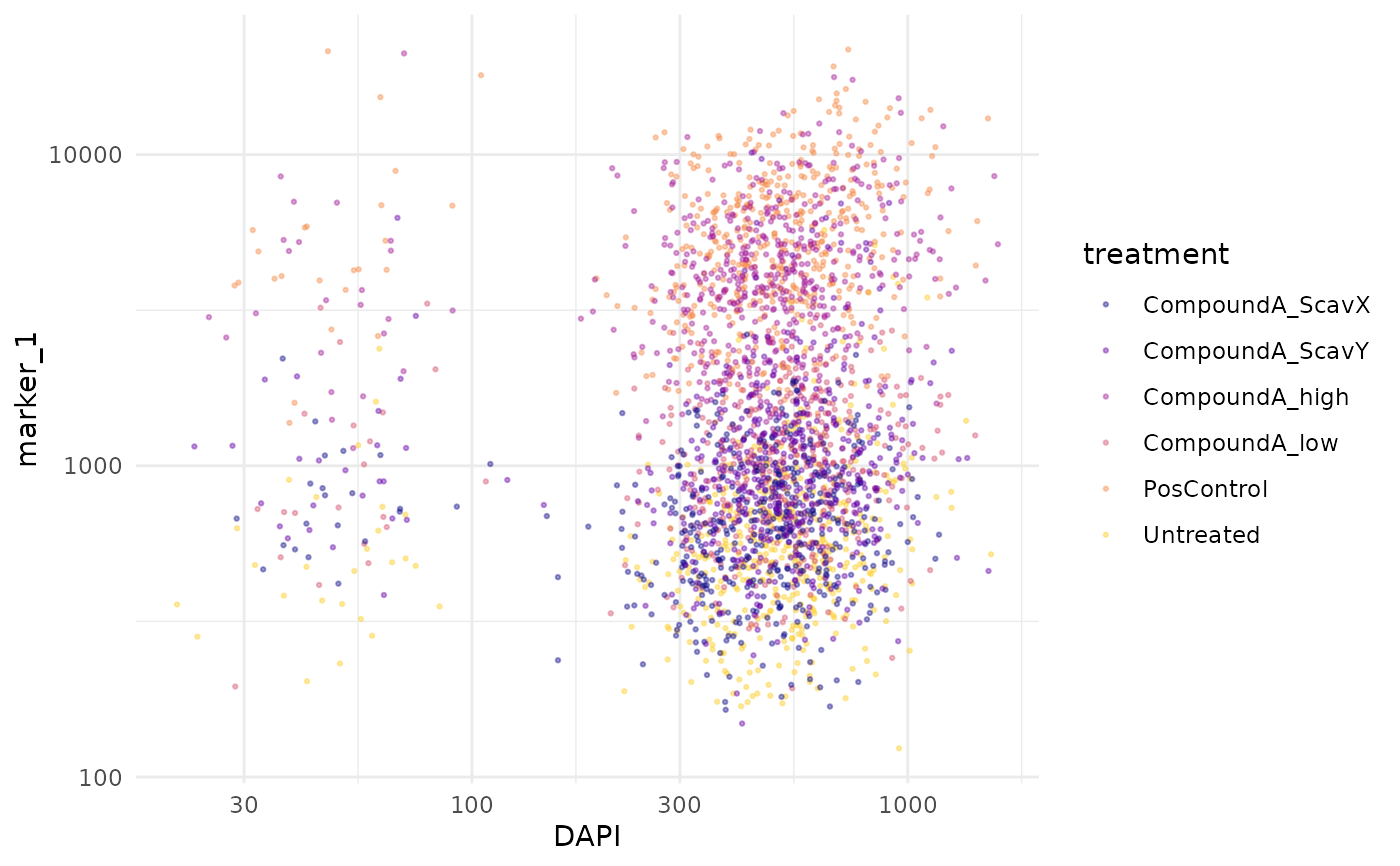
Biaxial scatter plot of two channels
Usage
cr_plot_scatter(
  experiment,
  channel_x,
  channel_y,
  color_by = "treatment",
  log_x = TRUE,
  log_y = TRUE
)
Arguments
- experiment
A cr_experiment.
- channel_x
X-axis channel.
- channel_y
Y-axis channel.
- color_by
Design column used for colour. Default
"treatment".
- log_x, log_y
Log-transform the respective axis.
See also
Other visualisation:
cr_plot_comparison(),
cr_plot_dose_response(),
cr_plot_effect_sizes(),
cr_plot_foldchange(),
cr_plot_heatmap(),
cr_plot_histogram(),
cr_plot_intensity(),
cr_plot_plate(),
cr_plot_qc(),
cr_plot_roc(),
cr_plot_spatial(),
cr_plot_timeline()