
Histogram of channel intensity
Usage
cr_plot_histogram(
  experiment,
  channel,
  group_by = "treatment",
  facet_by = NULL,
  log_x = TRUE
)Examples
exp <- cr_example_experiment(seed = 1, n_cells_per_well = 30)
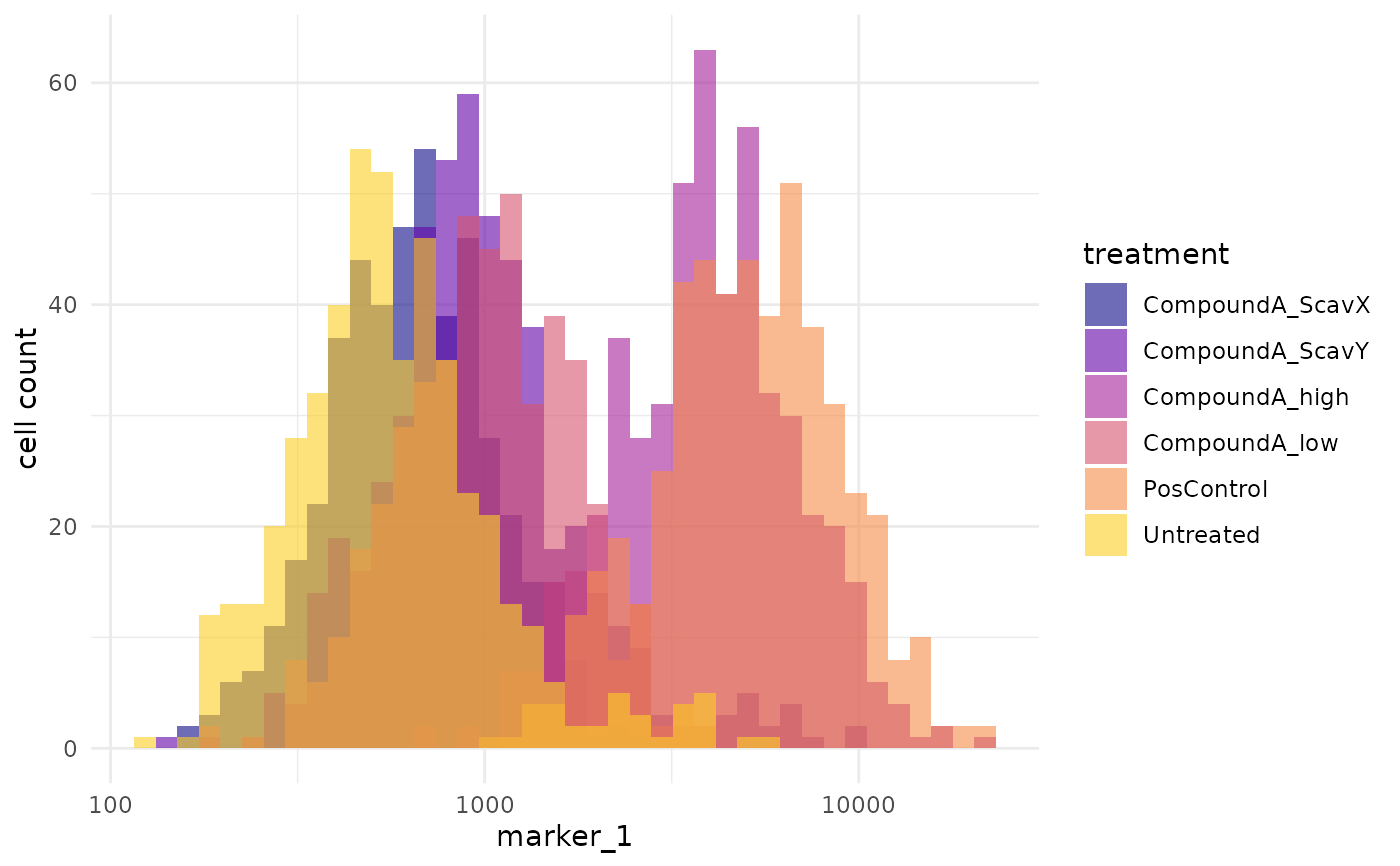
cr_plot_histogram(exp, "marker_1")
Histogram of channel intensity
cr_plot_histogram(
experiment,
channel,
group_by = "treatment",
facet_by = NULL,
log_x = TRUE
)exp <- cr_example_experiment(seed = 1, n_cells_per_well = 30)
cr_plot_histogram(exp, "marker_1")