20 Pilot operation, impact and monitoring
R. Heller · Date: 2026-07-28 · Last changed: 2026-11-09
20.1 Case and decision
It is Friday, 06:00, shift handover in the emergency department of a fictitious hospital. For 13 weeks the department has piloted a hint system that flags possible critical perfusion deficits in soft-tissue injuries from hyperspectral images; the system had passed an external validation in patients (an assumption of this teaching case, following the path of Chapter 19). On Monday the camera software was updated. The night consultant, who is the named oversight person for the pilot during the night shift, hands over to the early-shift consultant: the night just ended produced 4 alerts among 6 examined patients, against an average of 0.79 alerts per night shift before the update. Two nurses have filed concerns about repeated false alarms. The question at the handover is not whether the model is good. It is which observation, agreed in advance, means that the department stops using the hint now, who decides, and what happens instead.
20.2 Core reading
From a validated model to a supervised service. A successful external validation (Chapter 19) shows that a model can work in a new setting. It does not show that the department works better with it. Between the two lies a sequence of deliberately small steps, each with its own question. In shadow operation (silent mode), the system runs on real patients but its output is hidden from clinicians and compared with a reference afterwards: does it perform here, now, with our cameras and our case mix? In a supervised pilot, the output is shown, a named person oversees its use, and the department measures what changes in workflow, workload and safety. Only after that does a comparative study ask whether patients benefit. DECIDE-AI is the reporting guideline for this early clinical stage; it asks for the actual clinical performance at small scale, safety and the human factors of use (Vasey et al. 2022).
Human in the loop is a job, not a phrase. Oversight only exists if a named person has the time to look at each hint, the competence to judge it (including knowledge of the system’s typical errors), and a real possibility to override it without having to justify ignoring a machine. The AI Act describes the same elements for high-risk systems: oversight persons must be able to understand the system’s limitations, remain aware of automation bias, disregard or override the output and stop the system (Art. 14(4)), and deployers must assign oversight to people with the necessary competence, training, authority and support (Art. 26(2)) (European Parliament and Council of the European Union 2024). A review of automation bias in clinical decision support found workload and time pressure among its mediators (Goddard et al. 2012). An oversight person who also runs the resuscitation bay at night does not have the time the role requires.
Drift, update and alert burden. A deployed model meets a moving world. Case mix, documentation habits and devices change, and the clinician may not notice that the model’s inputs have shifted (Finlayson et al. 2021). Calibration of prediction models can drift over years even when discrimination stays stable (Davis et al. 2017). A software update of a measuring device is a sudden version of the same problem. The first visible sign is often not a lower accuracy figure, which needs a reference standard and time, but a change in how many alerts appear. Alert burden matters in its own right: in a primary care study, clinicians accepted fewer alerts as they received more of them, especially repeated ones (Ancker et al. 2017). In an external validation of a widely used sepsis model, alerts were generated for 18% of hospitalised patients while two thirds of sepsis cases were not flagged (Wong et al. 2021); published figures that show how burden and missed cases can coexist.
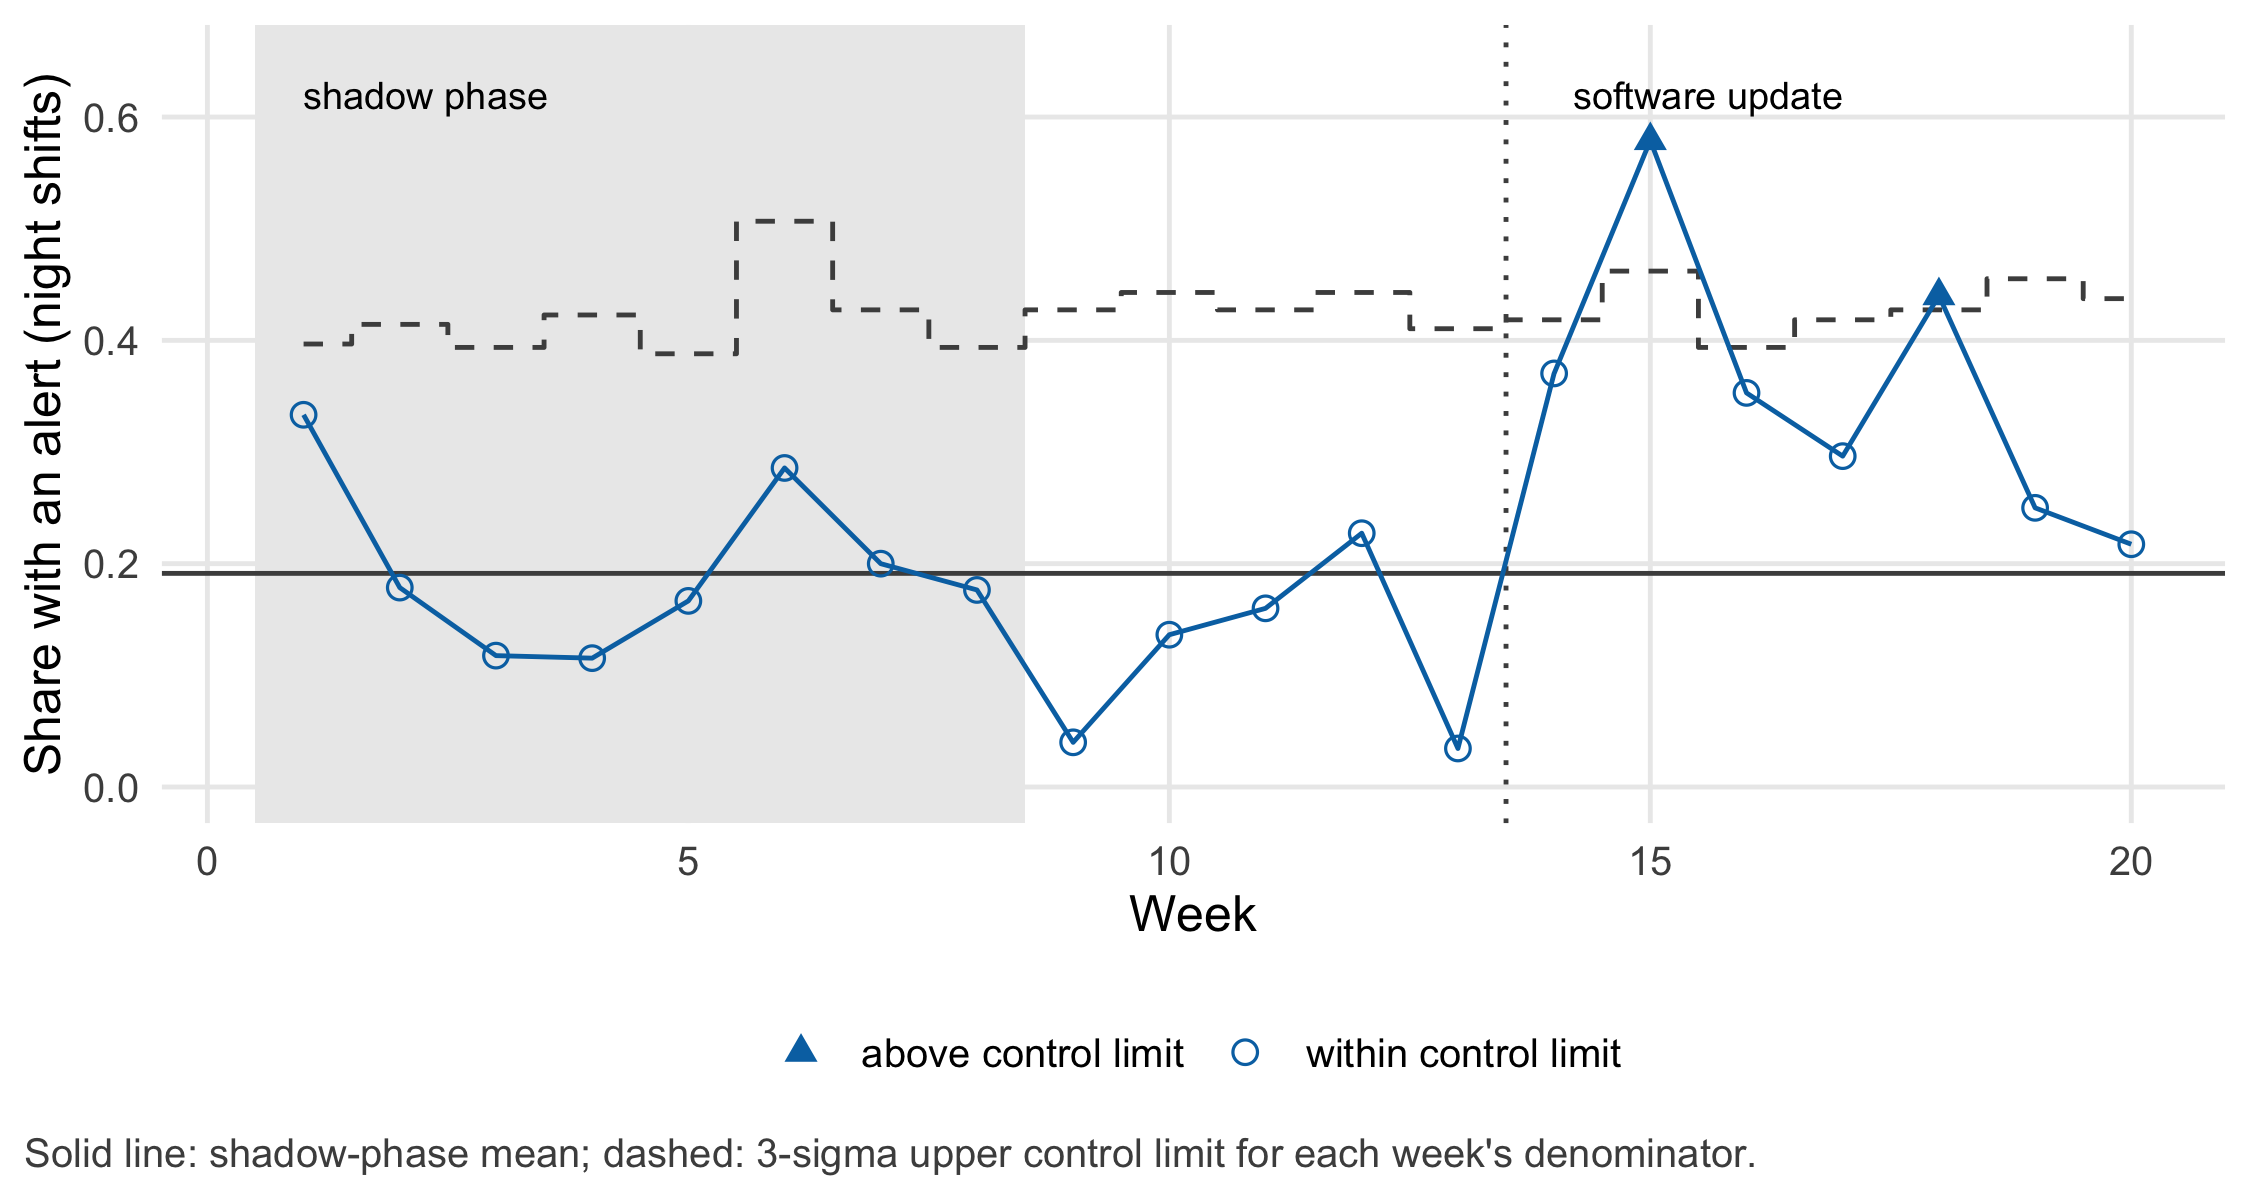
A rule written before the pilot. Figure 20.1 is a control chart from statistical process control, a tool long used in health-care quality improvement (Benneyan et al. 2003). The centre line and the upper limit come from the shadow phase, before anyone saw an alert. A weekly chart is too slow for the handover in the case, though: it can only flag a completed week, and in these data it flags the night shift for the first time in week 15. The department therefore also agreed on a per-shift rule. Before the update, a night shift had on average 0.79 alerts; under a Poisson model, four or more alerts in one night would occur in about 0.9% of nights by chance. The rule “four or more alerts in one night shift: suspend the hint for the rest of the shift, use the standard assessment, inform the pilot lead” was never triggered in the 13 weeks before the update and was triggered 2 times in the 49 nights after it.
The most important assumption. A stop rule protects patients only if it is written down before the pilot, with its denominator, its threshold, the person who acts on it and the fallback that replaces the system. A threshold chosen after seeing the data is an opinion, not a rule.
Who could carry the disadvantage? Three groups deserve explicit attention in this pilot. The night shift: fewer staff, dimmer light (the update changed image processing under low light in this teaching case) and therefore more false alerts per available person. The nurses, who perform the confirmatory checks that each alert triggers. And patients with darker skin types: optical measurements can perform differently across groups; pulse oximetry, for example, missed hidden hypoxaemia more often in Black than in White patients (11.7% versus 3.6% of measurements in one cohort; published) (Sjoding et al. 2020). In the synthetic pilot, darker skin types are about one in ten patients, so weekly numbers are tiny. The lab shows the dilemma this creates: small aggregates hide a real difference, and very small cells can reveal individuals.
Question for the workshop: Write the stop rule for your own project in one sentence: measure, denominator, threshold, person, fallback. Then name the group that would notice a problem last.
20.3 Lab
The lab simulates 20 weeks of a pilot: 8 weeks of shadow operation with a reference assessment for every patient, then 12 weeks of supervised use; the camera software update takes effect at the start of week 14. It then builds the monitoring measures, checks small aggregates and ends with a decision exercise at the shift handover.
NoteR start command
From the root of the book repository, render the chapter (this runs all code, including the figure of the core reading):
quarto render chapters/b20-pilot-operation-monitoring.qmd --to htmlTo run only the Lab code in a fresh R session, start from the chapters/ folder:
Rscript -e 'source(knitr::purl("b20-pilot-operation-monitoring.qmd", output = tempfile(fileext = ".R"), quiet = TRUE))'20.3.1 Step 1: simulate the pilot
All values are assumptions for teaching. Each shift sees a Poisson number of patients (about 6 early, 7 late, 4 at night). Of the patients, 12% have a critical perfusion deficit and 10% have darker skin types. The system’s score is higher for patients with a deficit, but the signal is weaker for darker skin types; an alert is shown when the score exceeds 1.4. The update adds 0.9 to the score of every patient examined in a night shift from week 14 on.
set.seed(2003)
shifts <- expand.grid(shift = c("early", "late", "night"), day = 1:7, week = 1:20,
                      stringsAsFactors = FALSE)                       # day 1 = Monday
shifts$n <- rpois(nrow(shifts), c(early = 6, late = 7, night = 4)[shifts$shift])
pts <- shifts[rep(seq_len(nrow(shifts)), shifts$n), c("week", "day", "shift")]
rownames(pts) <- NULL
N <- nrow(pts)
pts$darker_skin <- runif(N) < 0.10                                    # skin types V-VI (assumption)
pts$deficit <- runif(N) < 0.12                                        # reference: deficit present
signal <- ifelse(pts$darker_skin, 0.9, 1.9)                           # weaker optical signal (assumption)
update_effect <- ifelse(pts$week >= 14 & pts$shift == "night", 0.9, 0)
pts$score <- signal * pts$deficit + update_effect + rnorm(N)
pts$alert <- pts$score > 1.4
pts$phase <- ifelse(pts$week <= 8, "shadow", "supervised")
c(patients = N, per_week = round(N / 20), alerts = sum(pts$alert))
#> patients per_week alerts
#> 2355 118 395stopifnot(all(pts$alert <= 1), N == sum(shifts$n))20.3.2 Step 2: a weekly control chart per shift type
b20_weekly <- aggregate(cbind(alerts = alert, patients = 1) ~ week + shift, data = pts, FUN = sum)
base <- aggregate(cbind(alerts, patients) ~ shift, data = b20_weekly[b20_weekly$week <= 8, ], FUN = sum)
base$p_bar <- base$alerts / base$patients                             # centre line from the shadow phase
b20_weekly <- merge(b20_weekly, base[, c("shift", "p_bar")], by = "shift")
b20_weekly$p <- b20_weekly$alerts / b20_weekly$patients
b20_weekly$ucl <- b20_weekly$p_bar + 3 * sqrt(b20_weekly$p_bar * (1 - b20_weekly$p_bar) / b20_weekly$patients)
b20_weekly$flag <- b20_weekly$p > b20_weekly$ucl
b20_weekly <- b20_weekly[order(b20_weekly$shift, b20_weekly$week), ]
b20_flags <- b20_weekly[b20_weekly$flag, c("shift", "week", "alerts", "patients")]
b20_flags
#> shift week alerts patients
#> 55 night 15 11 19
#> 58 night 18 11 25b20_first_flag <- min(b20_flags$week[b20_flags$shift == "night"])
stopifnot(all(b20_weekly$alerts <= b20_weekly$patients),
!any(b20_weekly$flag[b20_weekly$week <= 13]), # no flag before the update
b20_first_flag == 15) # first night flag (this seed)20.3.3 Step 3: the per-shift stop rule
per_shift <- aggregate(cbind(alerts = alert, patients = 1) ~ week + day + shift, data = pts, FUN = sum)
# keep shifts without any patient (0 alerts): merge with the full list of shifts
per_shift <- merge(shifts[, c("week", "day", "shift")], per_shift, all.x = TRUE)
per_shift$alerts[is.na(per_shift$alerts)] <- 0
per_shift$patients[is.na(per_shift$patients)] <- 0
per_shift <- per_shift[order(per_shift$week, per_shift$day, match(per_shift$shift, c("early", "late", "night"))), ]
nights <- per_shift[per_shift$shift == "night", ]
b20_lambda_night <- mean(nights$alerts[nights$week <= 8])             # alerts per night, shadow phase
b20_p_rule <- 1 - ppois(3, b20_lambda_night)                          # P(4 or more) under the baseline
nights$trigger <- nights$alerts >= 4
b20_n_trig_after <- sum(nights$trigger[nights$week >= 14])
b20_n_nights_after <- sum(nights$week >= 14)
b20_trigger_night <- nights[nights$week >= 14 & nights$trigger, ][1, ]
nights[nights$week == 14, ]
#> week day shift alerts patients trigger
#> 276 14 1 night 1 4 FALSE
#> 279 14 2 night 1 3 FALSE
#> 282 14 3 night 0 1 FALSE
#> 285 14 4 night 4 6 TRUE
#> 288 14 5 night 0 4 FALSE
#> 291 14 6 night 1 4 FALSE
#> 294 14 7 night 3 5 FALSEstopifnot(b20_p_rule < 0.01, # rare by chance before the update
!any(nights$trigger[nights$week <= 13]),
b20_trigger_night$week == 14, b20_trigger_night$day == 4, # first trigger: Thursday night, week 14
b20_n_nights_after == 49, nrow(nights) == 140)The first trigger is the night shift starting on Thursday of week 14, which is the night in the case. The three earlier nights of that week had 1, 1, 0 alerts and looked unremarkable; a single night is a small sample, and the rule fired as soon as the agreed threshold was reached, not earlier.
20.3.4 Step 4: performance with honest denominators
In shadow operation every patient gets the reference assessment, so sensitivity (the share of patients with a deficit who received an alert) and positive predictive value (the share of alerts with a confirmed deficit) can both be estimated. In supervised use, the reference is only obtained for patients with an alert, so the sensitivity is no longer observable unless the department adds a reference check for a random sample of patients without an alert. The 95% intervals are exact (Clopper–Pearson) and computed with qbeta().
exact_ci <- function(x, n) c(lower = if (x == 0) 0 else qbeta(0.025, x, n - x + 1),
                             upper = if (x == n) 1 else qbeta(0.975, x + 1, n - x))
estimate <- function(d, what) {
  if (what == "sensitivity") { x <- sum(d$alert & d$deficit); n <- sum(d$deficit) }
  else { x <- sum(d$alert & d$deficit); n <- sum(d$alert) }
  c(x = x, n = n, est = x / n, exact_ci(x, n))
}
shadow <- pts[pts$phase == "shadow", ]
b20_perf <- rbind(
  "Sensitivity, shadow, all"           = estimate(shadow, "sensitivity"),
  "Sensitivity, shadow, darker skin"   = estimate(shadow[shadow$darker_skin, ], "sensitivity"),
  "Sensitivity, shadow, other"         = estimate(shadow[!shadow$darker_skin, ], "sensitivity"),
  "PPV, night, weeks 9-13"             = estimate(pts[pts$shift == "night" & pts$week %in% 9:13, ], "ppv"),
  "PPV, night, weeks 14-20"            = estimate(pts[pts$shift == "night" & pts$week >= 14, ], "ppv"),
  "PPV, day shifts, weeks 9-13"        = estimate(pts[pts$shift != "night" & pts$week %in% 9:13, ], "ppv"),
  "PPV, day shifts, weeks 14-20"       = estimate(pts[pts$shift != "night" & pts$week >= 14, ], "ppv")
)
round(b20_perf, 2)
#> x n est lower upper
#> Sensitivity, shadow, all 93 134 0.69 0.61 0.77
#> Sensitivity, shadow, darker skin 5 17 0.29 0.10 0.56
#> Sensitivity, shadow, other 88 117 0.75 0.66 0.83
#> PPV, night, weeks 9-13 8 14 0.57 0.29 0.82
#> PPV, night, weeks 14-20 14 62 0.23 0.13 0.35
#> PPV, day shifts, weeks 9-13 36 74 0.49 0.37 0.61
#> PPV, day shifts, weeks 14-20 43 90 0.48 0.37 0.59stopifnot(b20_perf["PPV, night, weeks 14-20", "est"] < b20_perf["PPV, night, weeks 9-13", "est"])After the update the positive predictive value at night falls from 57% to 23%, while in day shifts it is 49% before and 48% after the update. In the shadow phase, the sensitivity for patients with darker skin types is estimated at 5/17 (95% interval 10% to 56%), against 88/117 for other patients. The difference is visible, but the interval for the small group is wide.
20.3.5 Step 5: small aggregates and disclosure
Monitoring reports go to ward meetings, quality boards and sometimes to the manufacturer. A table of patients with a deficit by week and skin-type group has many cells with one, two or three patients. Such a cell, combined with the date and shift, can point to an identifiable person for colleagues who were on duty. A common safeguard is to suppress small counts (Hundepool et al. 2012); here, counts from 1 to 4 are shown as “<5” (a local rule, an assumption).
suppress <- function(x, min_n = 5) ifelse(x > 0 & x < min_n, "<5", as.character(x))
weekly_def <- as.data.frame.matrix(xtabs(~ week + darker_skin, data = pts[pts$deficit, ]))
names(weekly_def) <- c("other", "darker_skin")
weekly_report <- data.frame(week = as.integer(rownames(weekly_def)),
                            other = suppress(weekly_def$other),
                            darker_skin = suppress(weekly_def$darker_skin))
head(weekly_report, 8)
#> week other darker_skin
#> 1 1 19 <5
#> 2 2 12 <5
#> 3 3 16 <5
#> 4 4 12 <5
#> 5 5 14 <5
#> 6 6 15 <5
#> 7 7 16 <5
#> 8 8 13 <5# information loss: in how many weeks can the darker-skin cell be reported at all?
b20_visible_weeks <- sum(weekly_def$darker_skin >= 5 | weekly_def$darker_skin == 0)
b20_visible_weeks_n5 <- sum(weekly_def$darker_skin >= 5)
stopifnot(!any(weekly_report$darker_skin %in% as.character(1:4)), # no small count is printed
!any(weekly_report$other %in% as.character(1:4)))In none of the 20 weeks does the count of patients with darker skin types and a deficit reach five, so a weekly sensitivity for this group can never be reported. Over the 8-week shadow phase there are 17 such patients, enough to report the estimate above with its wide interval. Two consequences follow. Subgroup performance has to be monitored on longer, pre-agreed windows (for example the whole shadow phase and then every 12 weeks), with the minimum group size stated in the monitoring sheet. And a visible gap in a small group is a reason for a targeted check, for example an additional reference assessment for all patients of that group for a set period, not for waiting until the weekly report becomes informative. Note also that zero cells and row totals can make a suppressed cell computable; a report that prints totals needs a second suppressed cell in the same row.
20.3.6 The monitoring sheet
The sheet below turns the measures into actions. It is written before the pilot and reviewed on fixed dates. Roles are fictitious; the thresholds are assumptions agreed by the pilot group.
| Measure (denominator) | Rhythm | Trigger | Action and escalation | Responsible | Restart and review |
|---|---|---|---|---|---|
| Alerts per shift (per shift worked) | every shift | ≥ 4 alerts in one night shift, or ≥ 6 in a day shift | Suspend the hint for the rest of the shift, use the standard assessment, inform the pilot lead by the next morning | Named oversight physician of the shift | Restart next shift if the pilot lead finds no systematic cause |
| Alert share per week and shift type (patients examined) | weekly | Point above the upper control limit of the shadow phase | Check software version and image logs; review a sample of alerts | Pilot lead with medical technology | Review the chart limits after 4 weeks |
| Positive predictive value (alerts) | every 4 weeks, per shift type | Upper 95% limit below 30% | Review threshold and image quality; inform the manufacturer | Pilot lead | Re-evaluate after the next 4 weeks |
| Sensitivity (patients with a deficit; reference for all alerts plus a random 10% of patients without an alert) | every 4 weeks | Estimate below 50% or lower 95% limit below 35% | Increase the reference sample; consider suspension | Pilot lead, quality and patient safety officer | Decision in the pilot board |
| Sensitivity in darker skin types (patients with a deficit in that group; minimum n = 10) | end of shadow phase, then every 12 weeks | Estimate more than 20 percentage points below the other group | Targeted reference check for all patients of the group for 4 weeks | Quality and patient safety officer | Decision in the pilot board; report without cells below 5 |
| Override rate (alerts) | weekly | Change by more than half compared with the previous 4 weeks | Ask oversight staff why; check workload and training | Pilot lead with nursing lead | Review in the weekly pilot meeting |
| Software and model version (each start-up) | every start-up | Version differs from the released version | Block the hint automatically; fall back to the standard assessment | Medical technology / IT | Restart only with the released, verified version (Chapter 24) |
| Concerns and complaints from patients and staff (reports) | continuous, reviewed weekly | Any report of possible harm or a missed deficit | Case review within 72 hours; check whether a report to the manufacturer or authority is needed | Quality and patient safety officer | Documented in the pilot file |
| Exit criterion | any time | Two shift-rule triggers within 7 days without an explained and corrected cause, or one serious incident | Stop the pilot; standard assessment for all patients | Clinical director on the recommendation of the pilot board | Restart only after a new shadow phase of at least 2 weeks with all measures within limits |
20.3.7 Decision exercise at the shift handover
Material. The case at the start of the chapter, Figure 20.1, the table of week 14 nights from step 3, the two nurse concerns and Table 20.1.
Roles. Night consultant (oversight person, handing over), early-shift consultant (taking over), nurse in charge, pilot lead (by phone), quality and patient safety officer (joins at 08:00). A sixth person may act as patient representative.
Task. Within ten minutes, decide what happens with the hint in the early shift and the coming night, who is informed, and what must be true before the hint is used at night again. Write the decision in three sentences that could go into the handover record.
Expected result. The shift rule has fired (step 3). The weekly chart cannot settle the question at this handover: week 14 is not complete, and in these data the chart flags the night shift only in week 15 (step 2). The hint is suspended at least for night shifts; the standard assessment applies. The pilot lead is informed now, not on Monday, and checks with medical technology whether the update explains the change. Because the night of Thursday is the first trigger, the exit criterion is not yet met; a second trigger within 7 days without a corrected cause would stop the pilot. The concerns of the nurses are recorded as reports and reviewed within 72 hours.
Alternative. Raise the alert threshold for night shifts until the alert rate returns to its old level. This is tempting because it keeps the system running, but it is a model change made under time pressure, without a reference standard, and it may reduce sensitivity most for the patients whose signal is already weakest. If it is done at all, it belongs in a new shadow phase, not in a handover.
Remaining question. Is the episode a reportable event? That depends on the regulatory status of the system and on whether a patient was harmed or put at risk; the answer is open in this case and belongs to the quality and patient safety officer together with the manufacturer (Chapter 22).
20.4 Counter-check
Change the target population: the same system, unchanged, is introduced at a second site where 30% instead of 10% of patients have darker skin types. Predict before running: will the overall sensitivity rise, fall or stay the same? Will the subgroup be easier or harder to monitor?
set.seed(2004)
true_performance <- function(p_dark, n = 2e5) {   # large synthetic population: the "truth" of the simulation
  dark <- runif(n) < p_dark
  deficit <- runif(n) < 0.12
  alert <- ifelse(dark, 0.9, 1.9) * deficit + rnorm(n) > 1.4
  c(sensitivity = mean(alert[deficit]), sens_darker = mean(alert[deficit & dark]),
    sens_other = mean(alert[deficit & !dark]), ppv = mean(deficit[alert]))
}
b20_sites <- rbind(site_1 = true_performance(0.10), site_2 = true_performance(0.30))
round(b20_sites, 3)
#> sensitivity sens_darker sens_other ppv
#> site_1 0.651 0.318 0.689 0.520
#> site_2 0.582 0.313 0.697 0.494stopifnot(b20_sites["site_2", "sensitivity"] < b20_sites["site_1", "sensitivity"],
abs(b20_sites["site_2", "sens_darker"] - b20_sites["site_1", "sens_darker"]) < 0.03)These are the values of the simulation’s own truth, which no real department can observe. The overall sensitivity falls from 65% to 58%, although the model and its threshold are unchanged and the sensitivity within each group stays the same (about 32% and 69%). A change of case mix alone moves an overall figure; the validation in Chapter 19 and the monitoring here must therefore report the groups that make up the average. At the second site the subgroup is three times larger, so its cells pass the minimum size more often, and the gap that was hard to see at the first site becomes visible sooner.
20.5 Consequences for patients and operations
Ethics. The pilot redistributes work and risk. Night staff carry more false alerts per person, nurses carry the confirmatory checks, and patients with darker skin types may carry a lower chance that a deficit is flagged. A pilot that reports only overall figures makes these groups invisible. Human oversight is ethically meaningful only if the oversight person can actually decline the hint; documenting overrides without blame, and asking why they occur, is part of respecting that role (Chapter 21).
Regulation. If the system has a medical intended purpose, it qualifies as a medical device, and the manufacturer must run a post-market surveillance system that gathers and analyses data on quality, performance and safety (MDR, Art. 83) and must report serious incidents (Art. 87) (European Parliament and Council of the European Union 2017). A department that pilots a system that does not yet carry a CE marking may be conducting a clinical investigation, which has its own requirements; this is an open question to be checked with the regulatory affairs function (Chapter 22). An AI system that is itself a medical device, or a safety component of one, and that requires a third-party conformity assessment under the MDR is high-risk under Art. 6(1) and Annex I of the AI Act. For such systems the obligations of Chapter III, Sections 1 to 3, including human oversight (Art. 14) and the deployer obligations (Art. 26), apply from 2 August 2028 after the amendment by Regulation (EU) 2026/1744 (European Parliament and Council of the European Union 2026). Art. 26(5) asks deployers to monitor operation and, where they have reason to consider that use according to the instructions may result in a risk, to inform the provider or distributor and the market surveillance authority without undue delay and to suspend use (European Parliament and Council of the European Union 2024). Binding text: the regulations; whether the hint system in this case falls into these categories is a question for Chapter 22; the monitoring sheet is a local implementation. As of November 2026.
Data protection. Monitoring data are health data and are processed under the conditions of Art. 9 of the General Data Protection Regulation; the sheet should collect only what the measures need (data minimisation, Art. 5(1)(c)) (European Parliament and Council of the European Union 2016). Small cells in reports can identify patients; suppression, longer reporting windows and restricted access to detailed tables are the standard safeguards (Chapter 23, Chapter 26).
Security. The trigger in this case was a software update. Version checks at start-up, signed and verified releases, and a tested way back to the previous version are the controls that make the fallback real (Chapter 24). Feng et al. (2022) describe how monitoring and updating could be organised as a hospital quality improvement task.
20.6 Look up and transfer
- Reviewer question: For each monitored measure, what is the denominator, who sees it how often, which threshold was fixed before the pilot, and what is the fallback when the threshold is crossed? How is sensitivity measured once the output is shown to clinicians?
- Self-test: A pilot of a fracture hint (Chapter 9) reports “no safety concerns” after 8 weeks: of 412 alerts, 168 were confirmed fractures, and no missed fracture was reported by the wards. The reference was obtained only for alerted patients. What can and cannot be concluded, and what would you add to the monitoring?
TipAnswer
The positive predictive value can be estimated (168/412, about 41%). Sensitivity cannot: missed fractures among patients without an alert are only found if someone looks for them, and “no reports” depends on whether wards know how and where to report. Add a reference assessment for a random sample of patients without an alert, a structured follow-up (for example recall of patients with persistent pain), a pre-specified threshold for action, and reporting by shift and by relevant patient group with a minimum cell size.
- Annotated sources:
- Vasey et al. (2022) (DECIDE-AI) is the reporting guideline for early clinical evaluation of AI-based decision support, including human factors and safety.
- Finlayson et al. (2021) describe dataset shift from the clinician’s perspective; Davis et al. (2017) show calibration drift of prediction models over nine years.
- Ancker et al. (2017) link repeated and frequent alerts to lower acceptance; Goddard et al. (2012) review automation bias and its mediators.
- Wong et al. (2021) is an external validation in which a widely used model produced a high alert burden while missing most sepsis cases.
- Benneyan et al. (2003) introduce control charts for health-care improvement; Feng et al. (2022) adapt quality-improvement tools to the monitoring of clinical AI.
- Sjoding et al. (2020) document a measurement difference between patient groups for an optical device.
- Hundepool et al. (2012) is a reference text on statistical disclosure control, including cell suppression.
- European Parliament and Council of the European Union (2024), European Parliament and Council of the European Union (2026) and European Parliament and Council of the European Union (2017) are the binding texts for oversight, deployer duties and post-market surveillance.
In W7 the chapter supports the incident table-top exercise and the decision about restart. In W8 groups use the monitoring sheet to state an override or stop condition for their own model.
20.7 Further reading
- Chapter 19 for what the validation behind a pilot did and did not test.
- Chapter 21 for the ethics of shifting burdens between patients and staff.
- Chapter 24 for version control, signed releases and recovery after a faulty update.
- Chapter 26 for small aggregates and responsible sharing of monitoring results.
- Methods in R: Changepoint Detection for detecting when a monitored series has shifted.
- Methods in R: Subgroup Analyses for the limits of conclusions from small groups.
- CTTIR Courses, Course 4, Week 4 Session 5: TRIPOD-AI, fairness auditing, reproducibility at scale for a lab on auditing model performance across groups.
- Strategy in R: Fairness in Machine Learning for formal fairness criteria and their trade-offs.