21 Ethics at the bedside and in study design
R. Heller · Date: 2026-07-29 · Last changed: 2026-11-09
21.1 Case and decision
It is 23:10 in the fictitious emergency department of Chapter 9, setting A. An 84-year-old patient who lives alone has fallen onto her outstretched hand. The junior doctor sees no fracture on the wrist radiograph, but the image-analysis tool shows “possible fracture – second look recommended”. The radiology report will not be available before 08:30. Three people look at the same alert. The patient wants to know whether she can sleep in her own bed. The nurse in charge counts free trolleys and waiting alerts. A researcher who evaluates the tool asks whether alerts in patients over 80 are wrong more often than in younger patients. The doctor has to act now: keep the patient overnight, send her home with a splint and a morning call-back, or send her home without either. The patient carries most of the consequence, so she must understand the options and be able to say no.
21.2 Core reading
From a predictive value to a distribution of harm. In setting A of Chapter 9, 5% of the patients examined have a fracture, and the tool’s sensitivity and specificity are both 90% (assumptions). Of 1,000 patients, 140 receive an alert; 95 of them have no fracture, and 5 patients with a fracture receive no alert. Ethics begins where these counts meet people. A false alarm can mean an unnecessary splint, an extra radiograph, a night on a trolley or a delayed discharge. A missed fracture can mean a scaphoid that is not immobilised, weeks of pain and, later, an operation. The two errors do not fall on the same people, and they do not weigh the same for everyone. For a 30-year-old, a night in the department is an inconvenience. For an 84-year-old living alone, it brings a risk of delirium and falls. The question is therefore not only “how often is the tool wrong?” but “who carries each kind of error, and could they have chosen differently?”
Several lenses, one alert. Clinical ethics usually asks four questions: is the person’s autonomy respected, does the action benefit them, does it avoid harm, and are benefits and burdens shared fairly? The WHO guidance on AI for health adds that humans should remain in control of medical decisions and that people should understand the role an AI system plays in their care (World Health Organization 2024, Box 1, p. 5). It also names automation bias, in which a clinician overlooks an error that a human should have spotted, and the gradual loss of skills that makes it harder to overrule an algorithm (World Health Organization 2024, 11–12). A further lens is professional responsibility: the doctor remains accountable for the decision, whatever the box says. Table 21.1 applies these lenses to the three people in the case.
| Patient, 84, lives alone | Nurse in charge | Researcher evaluating the tool | |
|---|---|---|---|
| What matters most | Sleeping at home; not being sent away with a fracture | Safe care for everyone in the department tonight | A valid estimate of how the tool behaves in this population |
| Harm they see | Night on a trolley, delirium, a fall; or a missed fracture | Alerts that bind staff and trolleys; alert fatigue | Errors concentrated in a group that the overall figures hide |
| What they need | Plain numbers, real options, a contact person | A named person who reviews alerts, within planned time | Prespecified subgroups, counts with denominators, intervals |
| What they can object to | Staying overnight; any of the options offered | Being made responsible for reviews without time | A deployment plan that ignores an unexplained subgroup signal |
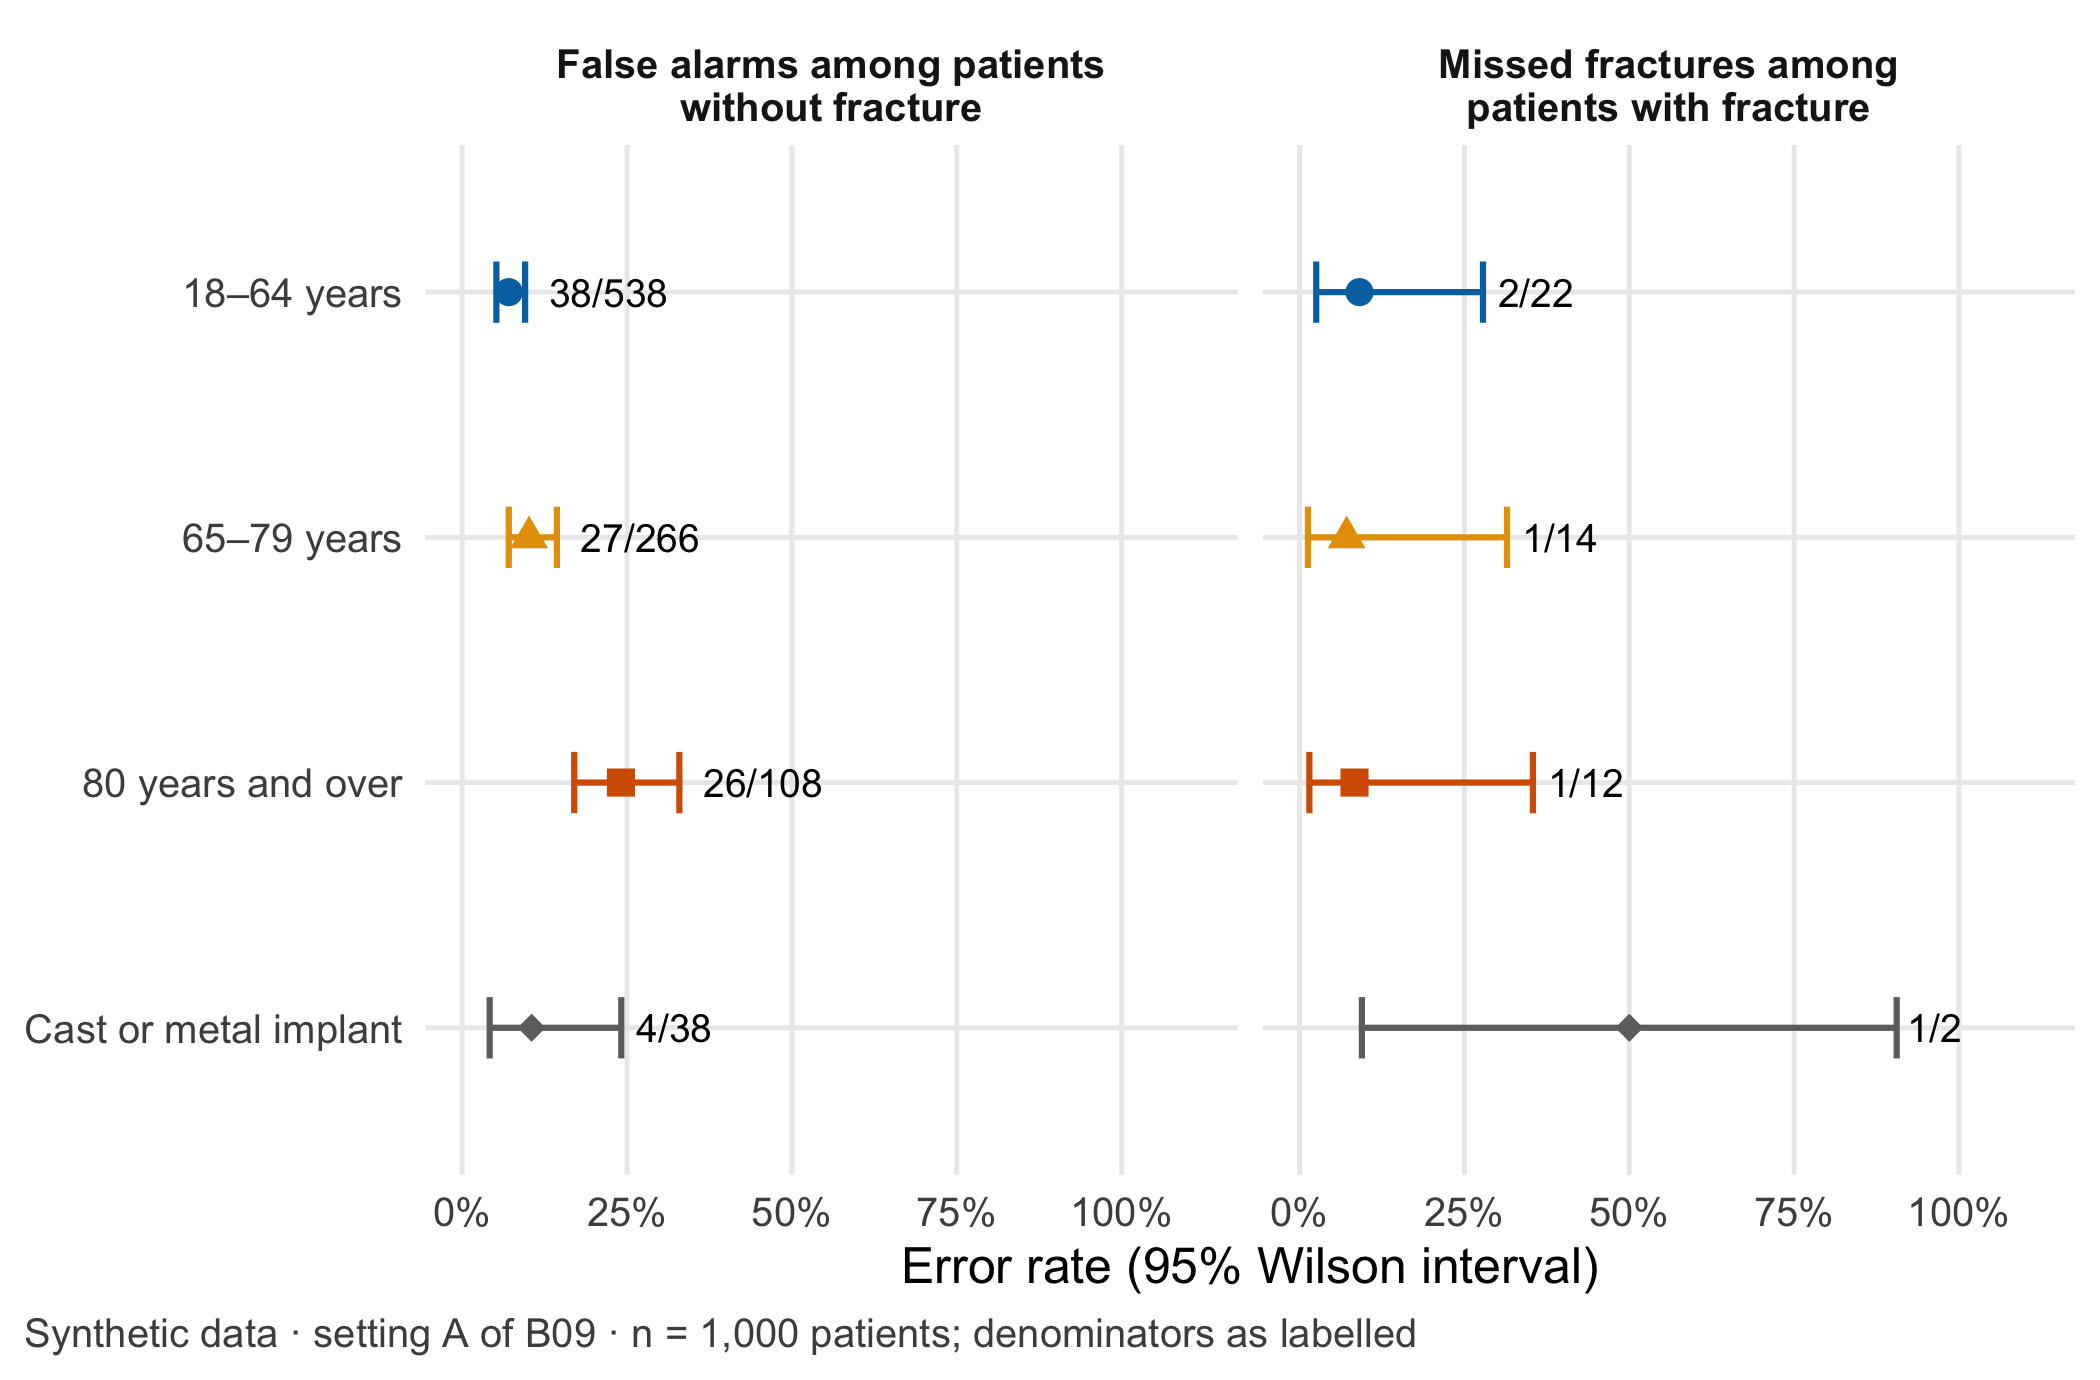
Errors by group need denominators. Figure 21.1 splits the 1,000 patients of setting A into four groups. The key assumption: the group counts are synthetic and were chosen so that the totals match setting A exactly; they show what a local evaluation would have to measure, not what any real tool does. Patients aged 80 and over make up 12% of those examined but receive 26 of the 95 false alarms (27.4%). Their false-alarm rate is 24.1% (26/108; 95% interval 17.0% to 32.9%), compared with 7.1% (38/538; 5.2% to 9.5%) in patients aged 18–64. Patients with a plaster cast or metal implant are a different case. Only 2 of them have a fracture, and the tool flags 1. A sensitivity of 50% with an interval from 9.5% to 90.5% means: we do not know. The intervals are Wilson score intervals, which behave well with small counts (Wilson 1927; Brown et al. 2001); the general idea is explained in Methods in R: Confidence intervals.
A group finding like this is a reason to look closer, not yet a proven property of the tool. Published examples show why the look is necessary. Chest radiograph classifiers underdiagnosed under-served patient groups, most clearly in intersectional subgroups such as Hispanic female patients [Seyyed-Kalantari et al. (2021); published]. A widely used population-health algorithm predicted health-care costs rather than illness, so that Black patients with the same score were sicker than White patients [Obermeyer et al. (2019); published]. In both cases a good overall figure hid a systematic burden on one group.
“Human in the loop” is a job description. The phrase protects patients only if it names someone. Four conditions make it real. First, a named role on the rota, not “the team”. Second, time: in setting A the tool creates about 1.6 alerts per shift (Chapter 9), and their review must be part of the planned workload. Third, competence: the reviewer knows the tool’s typical failure modes, including the groups in Figure 21.1. Fourth, a real possibility to override: disregarding the alert must be as easy as following it and must not require a written justification each time. For high-risk AI systems the EU AI Act requires deployers to assign human oversight to people with the necessary competence, training and authority, and to support them (Art. 26(2)); the system must let them stay aware of automation bias and disregard or override its output (Art. 14(4)(b) and (d)) (European Parliament and Council of the European Union 2024). For AI that is part of a medical device needing a notified body, these duties apply from 2 August 2028 (Chapter 22). Ethically, the four conditions apply from the first night. A systematic review found workload, task complexity and time pressure among the factors that increase automation bias (Goddard et al. 2012).
A real choice, checked with teach-back. Shared decision making moves from introducing the choice to describing options to helping the person decide (Elwyn et al. 2012). A choice is only real if the organisation has created the options: the splint is in stock, the morning call-back has a named slot, and someone can take the patient home at midnight. Teach-back closes the loop: the clinician asks the patient to explain in her own words what the alert means and what she will do. It tests the explanation, not the patient. In an observational study of patients with diabetes and limited health literacy, physicians checked understanding in only 12 of 61 visits; where they did, glycaemic control was better, with very wide confidence intervals [Schillinger et al. (2003); published].
Question for the workshop: The night team can offer only two of the three options from the case. Which option would you keep at all costs, and which group of patients would lose most if it disappeared?
21.3 Decision exercise
The exercise has two parts: a short R calculation that makes the group errors checkable, and a conversation in which the result has to be explained to the patient.
Part 1 – recompute the group errors. The table below is the input of Figure 21.1. The Wilson interval is written out as a small function and checked against prop.test(), whose interval without continuity correction is the same score interval.
# Synthetic counts for setting A (n = 1,000 patients)
groups[, c("group", "examined", "fracture", "true_pos", "false_pos")]
#> group examined fracture true_pos false_pos
#> 1 18–64 years 560 22 20 38
#> 2 65–79 years 280 14 13 27
#> 3 80 years and over 120 12 11 26
#> 4 Cast or metal implant 40 2 1 4# Check 1: the groups reproduce the totals of B09 (45/140 alerts with fracture)
stopifnot(sum(groups$true_pos) / (sum(groups$true_pos) + sum(groups$false_pos)) == 45 / 140)
# Check 2: own Wilson function equals prop.test() without continuity correction
for (i in seq_len(nrow(groups))) {
# prop.test() warns about its chi-squared p-value for small counts; the interval itself is unaffected
ref <- suppressWarnings(prop.test(groups$false_pos[i], groups$no_fracture[i], correct = FALSE))$conf.int
stopifnot(isTRUE(all.equal(unname(fa[i, ]), as.numeric(ref), tolerance = 1e-10)))
}
# Result table: rates with intervals, per group
result <- data.frame(
group = groups$group,
false_alarms = sprintf("%d/%d", groups$false_pos, groups$no_fracture),
false_alarm_rate = cdsr_percent(fa_rate),
fa_95_interval = apply(fa, 1, fmt_ci),
ppv = cdsr_percent(groups$true_pos / (groups$true_pos + groups$false_pos)),
share_of_false_alarms = cdsr_percent(groups$false_pos / sum(groups$false_pos))
)
result#> group false_alarms false_alarm_rate fa_95_interval ppv
#> 1 18–64 years 38/538 7.1% 5.2% to 9.5% 34.5%
#> 2 65–79 years 27/266 10.2% 7.1% to 14.4% 32.5%
#> 3 80 years and over 26/108 24.1% 17.0% to 32.9% 29.7%
#> 4 Cast or metal implant 4/38 10.5% 4.2% to 24.1% 20.0%
#> share_of_false_alarms
#> 1 40.0%
#> 2 28.4%
#> 3 27.4%
#> 4 4.2%# Check 3: the intervals of the oldest and the youngest group do not overlap (in this synthetic example)
stopifnot(fa[old, "lower"] > fa[young, "upper"])
# Check 4: the cast group's sensitivity interval is wider than 0.75 - too few fractures to say anything
stopifnot(diff(sens_ci[cast, ]) > 0.75)The calculation shows two different findings. In the oldest group the false-alarm rate is higher, and the interval excludes the rate of the youngest group. In the cast group nothing can be concluded about sensitivity, because two fractures are not a denominator. Both findings change the conversation with the patient: her group has a lower predictive value (29.7%) than the department as a whole (32.1%).
Part 2 – the conversation. Work in threes: doctor, patient, observer. The doctor has five minutes. The script below is a starting point, not a text to read aloud.
NoteConversation card: alert, options, teach-back
- Name the situation. “The computer program that looks at X-rays has marked your wrist. That does not mean it is broken. It means a specialist should look again.”
- Give the number in people. “In patients of your age in our department, about 3 in 10 of these marks turn out to be a real fracture.” (In a real department this figure must come from local data; here it is the synthetic 29.7%.)
- Offer the real options. “You can stay here tonight and we will have the answer in the morning. Or you can go home with a removable splint; we will phone you before 10:00 with the result and tell you whether to come back. If the pain or swelling gets worse, you come back at once.”
- Ask what matters. “What is most important to you tonight?”
- Teach-back. “I want to make sure I explained this well. Could you tell me in your own words what the mark means and what you will do if the pain gets worse?”
- Document the choice, the reason the patient gave and who will make the call-back.
The observer notes whether the doctor gave the number in people, whether both options were presented with their downsides, whether the patient’s answer in step 5 was correct and whether the doctor corrected the explanation, not the patient.
Expected result. A documented decision that the patient can repeat in her own words, a call-back owner with a time, and a note of the predictive value used for her group, marked as local or synthetic.
Alternative. The doctor calls the on-call senior to review the image now. This avoids the night-time uncertainty but uses scarce senior time; it is the right choice if the department has planned it as part of the reviewer’s role.
Residual question. Who decides whether the call-back option is offered at all, and what happens to patients who cannot be reached by phone?
21.4 Counter-check
Change the target population before you calculate. Suppose the same group-specific error rates apply in setting B of Chapter 9, where 20% of patients have a fracture. Predict first: does the predictive value in the oldest group rise or fall, and does the oldest group’s share of false alarms change?
# Setting B: same group sizes, more fractures (synthetic, 200 in total)
fracture_b <- c(90, 60, 40, 10)
stopifnot(sum(fracture_b) == 200)
tp_b <- fracture_b * sens                                     # expected true alerts
fp_b <- (groups$examined - fracture_b) * fa_rate              # expected false alerts
data.frame(group = groups$group,
           ppv_setting_A = cdsr_percent(groups$true_pos / (groups$true_pos + groups$false_pos)),
           ppv_setting_B = cdsr_percent(tp_b / (tp_b + fp_b)),
           share_false_alarms_B = cdsr_percent(fp_b / sum(fp_b)))
#> group ppv_setting_A ppv_setting_B share_false_alarms_B
#> 1 18–64 years 34.5% 71.1% 42.6%
#> 2 65–79 years 32.5% 71.4% 28.6%
#> 3 80 years and over 29.7% 65.6% 24.7%
#> 4 Cast or metal implant 20.0% 61.3% 4.1%# Check: PPV in the oldest group rises with prevalence
stopifnot(tp_b[old] / (tp_b[old] + fp_b[old]) > groups$true_pos[old] / (groups$true_pos[old] + groups$false_pos[old]))
# Second counter-check: ten times as many patients with cast, same rates
mis_big <- wilson(10 * groups$false_neg[cast], 10 * groups$fracture[cast])
c(width_n2 = diff(mis[cast, ]), width_n20 = diff(mis_big[1, ]))#> width_n2.upper width_n20.upper
#> 0.8109376 0.4014040stopifnot(diff(mis_big[1, ]) < diff(mis[cast, ]))In setting B the predictive value rises in every group, because a larger share of patients has a fracture. The oldest group still carries a disproportionate share of the false alarms. Prevalence changes the predictive value, not the group’s error rate. The second check shows that a larger denominator narrows the interval but leaves the point estimate unchanged; it would take many more patients with casts before the miss rate could be called high or low. A practical consequence: the overall specificity of 90% in Chapter 9 is itself an average over a case mix. If the case mix shifts towards older patients, the department’s overall false-alarm rate rises even if the tool does not change.
21.5 Consequences for patients and operations
An ethically questionable recommendation changes the plan. Suppose the supplier proposes to sort the radiology worklist by alert status: flagged images are reported first, unflagged images up to 24 hours later. On average this looks efficient. In setting A, however, 5 of the 50 fractures are unflagged and would wait longest, and in the cast group the tool missed one of two fractures – nobody knows how often it misses more. The burden of delay would fall on a group for which the tool is least reliable and whose patients cannot know that their image was put at the back of the queue. Table 21.2 shows how the deployment plan changes.
| Element | Plan before the review | Plan after the review |
|---|---|---|
| Worklist order | Sorted by alert status | Clinical order unchanged; the alert only adds a second-look flag |
| Human oversight | “Clinician in the loop” | Named on-call senior per shift; review time planned per alert; override without justification form |
| Cast or metal implant | Included | Excluded from the alert until a local evaluation with enough fractures exists; always senior review |
| Patients 80 and over | No special rule | Group-specific predictive value reported monthly with interval; call-back option guaranteed |
| Conversation | Information leaflet | Conversation card with teach-back; documented choice and call-back owner |
Regulation and data protection. Excluding a patient group or changing what the alert is used for may change the intended purpose of the product; Chapter 22 shows why this needs a dated note before go-live. Group analyses require processing age and possibly further characteristics. Ethnicity or disability would be special categories of personal data under the GDPR; the amended AI Act now sets strict conditions under which providers of high-risk systems may exceptionally process such data to detect and correct bias (Art. 4a, inserted by Regulation (EU) 2026/1744, in force since 27 July 2026) (European Parliament and Council of the European Union 2026). Chapter 23 covers the data-protection side.
Security and availability. If the tool fails, the plan must still give every patient a timely report. This fallback is the regular reporting pathway, tested as described in Chapter 24.
NoteThe incident from the ethics perspective
In the fictional incident of Part VI, an excerpt from a radiology report appears in a service provider’s support log, and the installed model version differs from the approved one. From an ethics perspective the first questions are: which patients are affected, who among them is particularly burdened (for example by a sensitive diagnosis in the excerpt), and who explains the situation to them in plain language? A good answer names a reachable contact person, offers to answer questions by phone and in writing, and does not wait for the end of the technical analysis to decide whether patients deserve an explanation. Whether a formal notification is legally required is a separate question (Chapter 23).
21.6 Look up and transfer
Reviewer question. Were the subgroups prespecified, and does the report give numerator, denominator and an interval for each error rate in each subgroup? A sentence such as “performance was similar across age groups” without counts cannot be checked (Methods in R: Subgroup analyses).
Self-test. A paediatric emergency department wants to use the same tool for children aged 6–15. Growth plates can look like fracture lines. A local check finds 18 false alarms among 60 children without fracture and 3 missed fractures among 15 children with fracture. The supplier says: “Overall accuracy in children is 72%.” What would you report to the department, and which ethical question would you raise before go-live?
TipAnswer
Report the two errors separately with their denominators and intervals: false alarms 18/60 = 30.0% (Wilson 95% interval about 19.9% to 42.5%) and missed fractures 3/15 = 20.0% (about 7.0% to 45.2%). Overall accuracy mixes the two and hides that each child without fracture has roughly a one-in-three chance of a false alarm. The ethical question is who bears the burden: false alarms in children mean extra radiation and immobilisation; misses mean untreated fractures in growing bones. Before go-live, the department needs a named reviewer for paediatric alerts, an explanation for parents and a decision on whether the evidence (15 fractures) is enough at all. Children were not part of the intended population in the setting A data; using the tool for them is a change of intended purpose (Chapter 22).
Annotated sources.
- World Health Organization (2024) – the six WHO principles (Box 1) and the description of automation bias and skills loss; used here for autonomy and human control.
- European Parliament and Council of the European Union (2024) – Art. 14(4) and Art. 26(2) translate human oversight into duties of providers and deployers; used for the four conditions of a real “human in the loop”.
- European Parliament and Council of the European Union (2026) – inserts Art. 4a on processing special categories of data for bias detection; relevant to the design of subgroup analyses.
- Wilson (1927) and Brown et al. (2001) – the original score interval and the comparison showing why simple intervals for proportions fail with small counts.
- Seyyed-Kalantari et al. (2021) and Obermeyer et al. (2019) – published cases in which good overall performance hid systematic harm to specific groups.
- Goddard et al. (2012) – systematic review of automation bias and its mediators, including workload and time pressure.
- Elwyn et al. (2012) and Schillinger et al. (2003) – a practical model of shared decision making and an observational study of checking patients’ understanding.
21.7 Further reading
- Chapter 9 – the alert, the two settings and the predictive values on which this chapter builds.
- Chapter 6 – thresholds and absolute frequencies, to weigh false alarms against missed fractures.
- Chapter 20 – how group-specific error rates enter a monitoring plan with escalation and stop criteria.
- Chapter 22 and Chapter 23 – when a change in the patient group changes the intended purpose, and how group data may be processed.
- Scientometrics in R: Ethics and responsible metrics – why a single indicator should not decide about people; transferable to alert metrics.
- Scientometrics in R: Gender and equity analysis – pitfalls when comparing groups, including small groups and inferred attributes.
- CTTIR Courses: TRIPOD-AI, fairness auditing, reproducibility at scale – a lab that audits model errors by group.
- Strategy in R: Fairness in machine learning – formal fairness criteria and why they cannot all hold at once.