| Risk | Chapters (read the first one first) | Workshops |
|---|---|---|
| A faulty or harmful alarm, too many false alarms | Chapter 20, Chapter 27, Chapter 21, Chapter 9, Chapter 6 | W3, W7, W8 |
| Leakage between training and test in grouped data | Chapter 19, Chapter 5, Chapter 27 | W4 |
| Wrong n: repeated measurements counted as independent | Chapter 3, Chapter 16, Chapter 10 | W1, W4 |
| Poor calibration in a new setting | Chapter 6, Chapter 19 | W3 |
| Selection or collider bias | Chapter 2 | W5 |
| Clusters that are artefacts of scaling or segmentation | Chapter 14, Chapter 12 | W5 |
| Unit errors and unidentifiable parameters | Chapter 15 | W6 |
| Distribution shift after an update or a season | Chapter 20, Chapter 17 | W6, W7 |
| Errors that fall unequally on groups | Chapter 21, Chapter 6 | W3, W8 |
| Unclear intended purpose or changed use | Chapter 22 | W7 |
| Unlawful data flow or re-identification of rare groups | Chapter 23, Chapter 26 | W7 |
| Data leak, wrong model version or outage | Chapter 24, Chapter 25, Chapter 20 | W7 |
| Instructions hidden in documents | Chapter 25 | W2, W7 |
| Overstated claim in an abstract | Chapter 27, Chapter 7 | W8 |
28 Case atlas, glossary and transfer
R. Heller · Date: 2026-07-31 · Last changed: 2026-11-09
28.1 Case and decision
A newly appointed research coordinator in a fictitious trauma department receives three requests in her first week. The rehabilitation team wants to check gait after ankle fractures with tablet videos. A laboratory group asks whether it may publish hundreds of spectra from six animals as “a large dataset”. The operating theatre manager wants to know whether a second weekend team is worth the cost. She has two days to send each group a first answer: which question they are really asking, which chapter they should read first, and which risk they must rule out before anyone writes code. If she routes the requests by data type alone, the gait group starts with image processing and the laboratory with model choice; both would miss the problem that decides their project.
28.2 Core reading
28.2.1 Start from the decision, not from the data
This chapter is the index of the book, organised by decisions. Most projects arrive with a data type – images, spectra, a registry – and a method someone has heard of. The data type is a poor guide. A tablet video can serve a method comparison (Chapter 11), a privacy assessment (Chapter 23) or a safety pilot (Chapter 20), and each needs a different first step. The key assumption of this chapter is that a method is found again through the decision it supports and the risk that threatens it, not through the data it uses. The data type narrows the choice; the decision and the risk make it.
The chapter offers three tools for this. The navigator gives three entry routes to the 28 chapters: by goal, by data type and by risk. The case atlas contains six new project vignettes, from a fracture alert to operating capacity. Each one shows how a request turns into a target statement, a first test and a path through the chapters. The glossary translates the book’s terms between English and German, so that a reader can recognise a term from clinical practice and find the chapter where it is introduced. A register of common mistakes and a one-page sketch for the next experiment close the chapter. Its tables are stored as data in the chapter source, and the Lab checks that every route points to an existing chapter.
28.2.2 The route by risk
The risk route is the fastest when something has already gone wrong or is about to (Table 28.1). Each row names a risk, the chapters that address it and the workshops in which it is practised. The first chapter in each row is the one to open first.
28.2.3 Two reading routes as examples
A clinician after a faulty alarm. An alert flagged a fracture that was not there, and the patient received an unnecessary CT scan. The clinician wants to know who must be told and who decides whether the alert stays on. The risk route “a faulty or harmful alarm” leads first to Chapter 20, where the monitoring plan names the escalation path, the fallback procedure and the person who may stop the pilot. The decision sheet in Chapter 27 records that person, and Section 27.3.3 lists who acts next, in order; Chapter 21 helps to explain the event to the patient. The next responsible role is therefore the pilot lead named in the decision sheet as allowed to stop – not the developer and not the clinician who happened to see the alert.
A doctoral researcher with grouped spectra. Hundreds of spectra come from a handful of animals. The data route “hyperspectral images and grouped spectra” leads to Chapter 10 for the measurement, to Chapter 19 for a split by animal with an ID overlap of zero, and to Chapter 27 for the passport and the reporting path (Table 27.1): ARRIVE 2.0 for the animal study, TRIPOD+AI items for the model. The fill-in templates in Methods in R: ARRIVE and Methods in R: TRIPOD-AI complete the report.
28.2.4 Combining routes: the coordinator’s three requests
The routes work best in combination. For the gait request, the data route (“video, landmarks and joint angles”) offers Chapter 11 and Chapter 23, and the risk route (“unlawful data flow or re-identification”) offers Chapter 23 and Chapter 26. The chapter that appears in both, Chapter 23, is where the coordinator starts: before anyone compares measurement methods, the team must know whether raw video may be stored at all and when it is deleted. For the laboratory, the data route leads to the split by animal in Chapter 19; “a large dataset” of spectra from six animals is, for any statement about new animals, a dataset of six. For the operating theatre, two goal rows compete: “forecast demand” (Chapter 17) and “compare capacity scenarios” (Chapter 18). The decision is about staffing, so the simulation is the main tool and the forecast supplies its arrival assumptions. In each case the first chapter is chosen by the decision and the risk; the data type only narrows the list.
28.2.5 Working with the atlas
Each vignette in the atlas follows the same form: the decision, the data and the independent unit, a first baseline, the main risk, a first observable test, the path through the chapters and the matching workshops. Read the vignette nearest to your own project, then write your own version in the same fields before you open any chapter. The formative model answers are kept separate and folded away, so that the attempt comes first. They are not marking schemes; they show what a complete first answer contains.
Question for the workshop: Choose the vignette nearest to your project (W1) or to the project you defended (W8). Which field of your own brief differs most from the vignette, and which chapter does that difference send you to?
28.3 Lab
The navigator, the atlas, the glossary and the register of mistakes are data frames in the source of this chapter. The Lab checks them in the same way that a passport is checked: every route must lead to an existing chapter, every atlas case must point to at least two chapters and one workshop, and the glossary must cover the book.
# Size of the tables
c(navigator_rows = nrow(navigator), atlas_cases = length(atlas),
  glossary_terms = nrow(glossary), mistakes = nrow(mistakes))
#> navigator_rows atlas_cases glossary_terms mistakes
#> 50 6 95 18nav_ids <- trimws(unlist(strsplit(navigator$chapters, ",")))
mis_ids <- trimws(unlist(strsplit(mistakes$chapters, ",")))
atlas_ids <- unlist(lapply(atlas, `[[`, "path"))
stopifnot(
length(atlas) == 6,
all(sapply(atlas, function(a) length(a$path) >= 2 && length(a$ws) >= 1)),
all(unlist(lapply(atlas, `[[`, "ws")) %in% workshops$id),
all(c(nav_ids, mis_ids, atlas_ids, glossary$chapter) %in% chapter_ids), # no dangling references
nrow(glossary) >= 60, !anyDuplicated(tolower(glossary$term)),
all(chapter_ids %in% nav_ids) # every chapter reachable
)All 28 chapters are reachable from the navigator, and no route points to a chapter that does not exist. The two reading routes of the Core reading can be tested as searches. The function returns the chapters of every navigator row whose entry contains the search term, in order of first appearance.
find_route <- function(term) {
  rows <- navigator[grepl(term, navigator$entry, ignore.case = TRUE), ]
  unique(trimws(unlist(strsplit(rows$chapters, ","))))
}
route_alarm   <- find_route("alarm")
route_spectra <- find_route("spectra")
route_alarm
#> [1] "b20" "b27" "b21" "b09" "b06"route_spectra#> [1] "b10" "b19" "b27"stopifnot(route_alarm[1] == "b20", "b27" %in% route_alarm,
all(c("b10", "b19", "b27") %in% route_spectra))The atlas map shows which chapters the six vignettes use and in which order (Figure 28.1). Chapters that no vignette touches are not unimportant; they are reached through the navigator.
library(ggplot2)

map_df <- do.call(rbind, lapply(names(atlas), function(v)
  data.frame(vignette = v, chapter = atlas[[v]]$path, step = seq_along(atlas[[v]]$path))))
map_df$chapter <- factor(toupper(map_df$chapter), levels = toupper(chapter_ids))
map_df$vignette <- factor(map_df$vignette, levels = rev(names(atlas)))
map_df$first <- ifelse(map_df$step == 1, "first chapter", "later chapter")

ggplot(map_df, aes(chapter, vignette)) +
  geom_tile(aes(fill = first), colour = "white", linewidth = 0.8) +
  geom_text(aes(label = step), size = 3.2) +
  scale_x_discrete(drop = FALSE) +
  scale_fill_manual(values = c("first chapter" = unname(cdsr_colours["orange"]),
                               "later chapter" = unname(cdsr_colours["skyblue"])), name = NULL) +
  labs(x = NULL, y = "Vignette", caption = "Paths as listed in the case atlas; numbers give the reading order.") +
  theme_cdsr(base_size = 11) +
  theme(axis.text.x = element_text(angle = 90, vjust = 0.5, hjust = 1), panel.grid = element_blank())

stopifnot(nrow(map_df) == length(atlas_ids))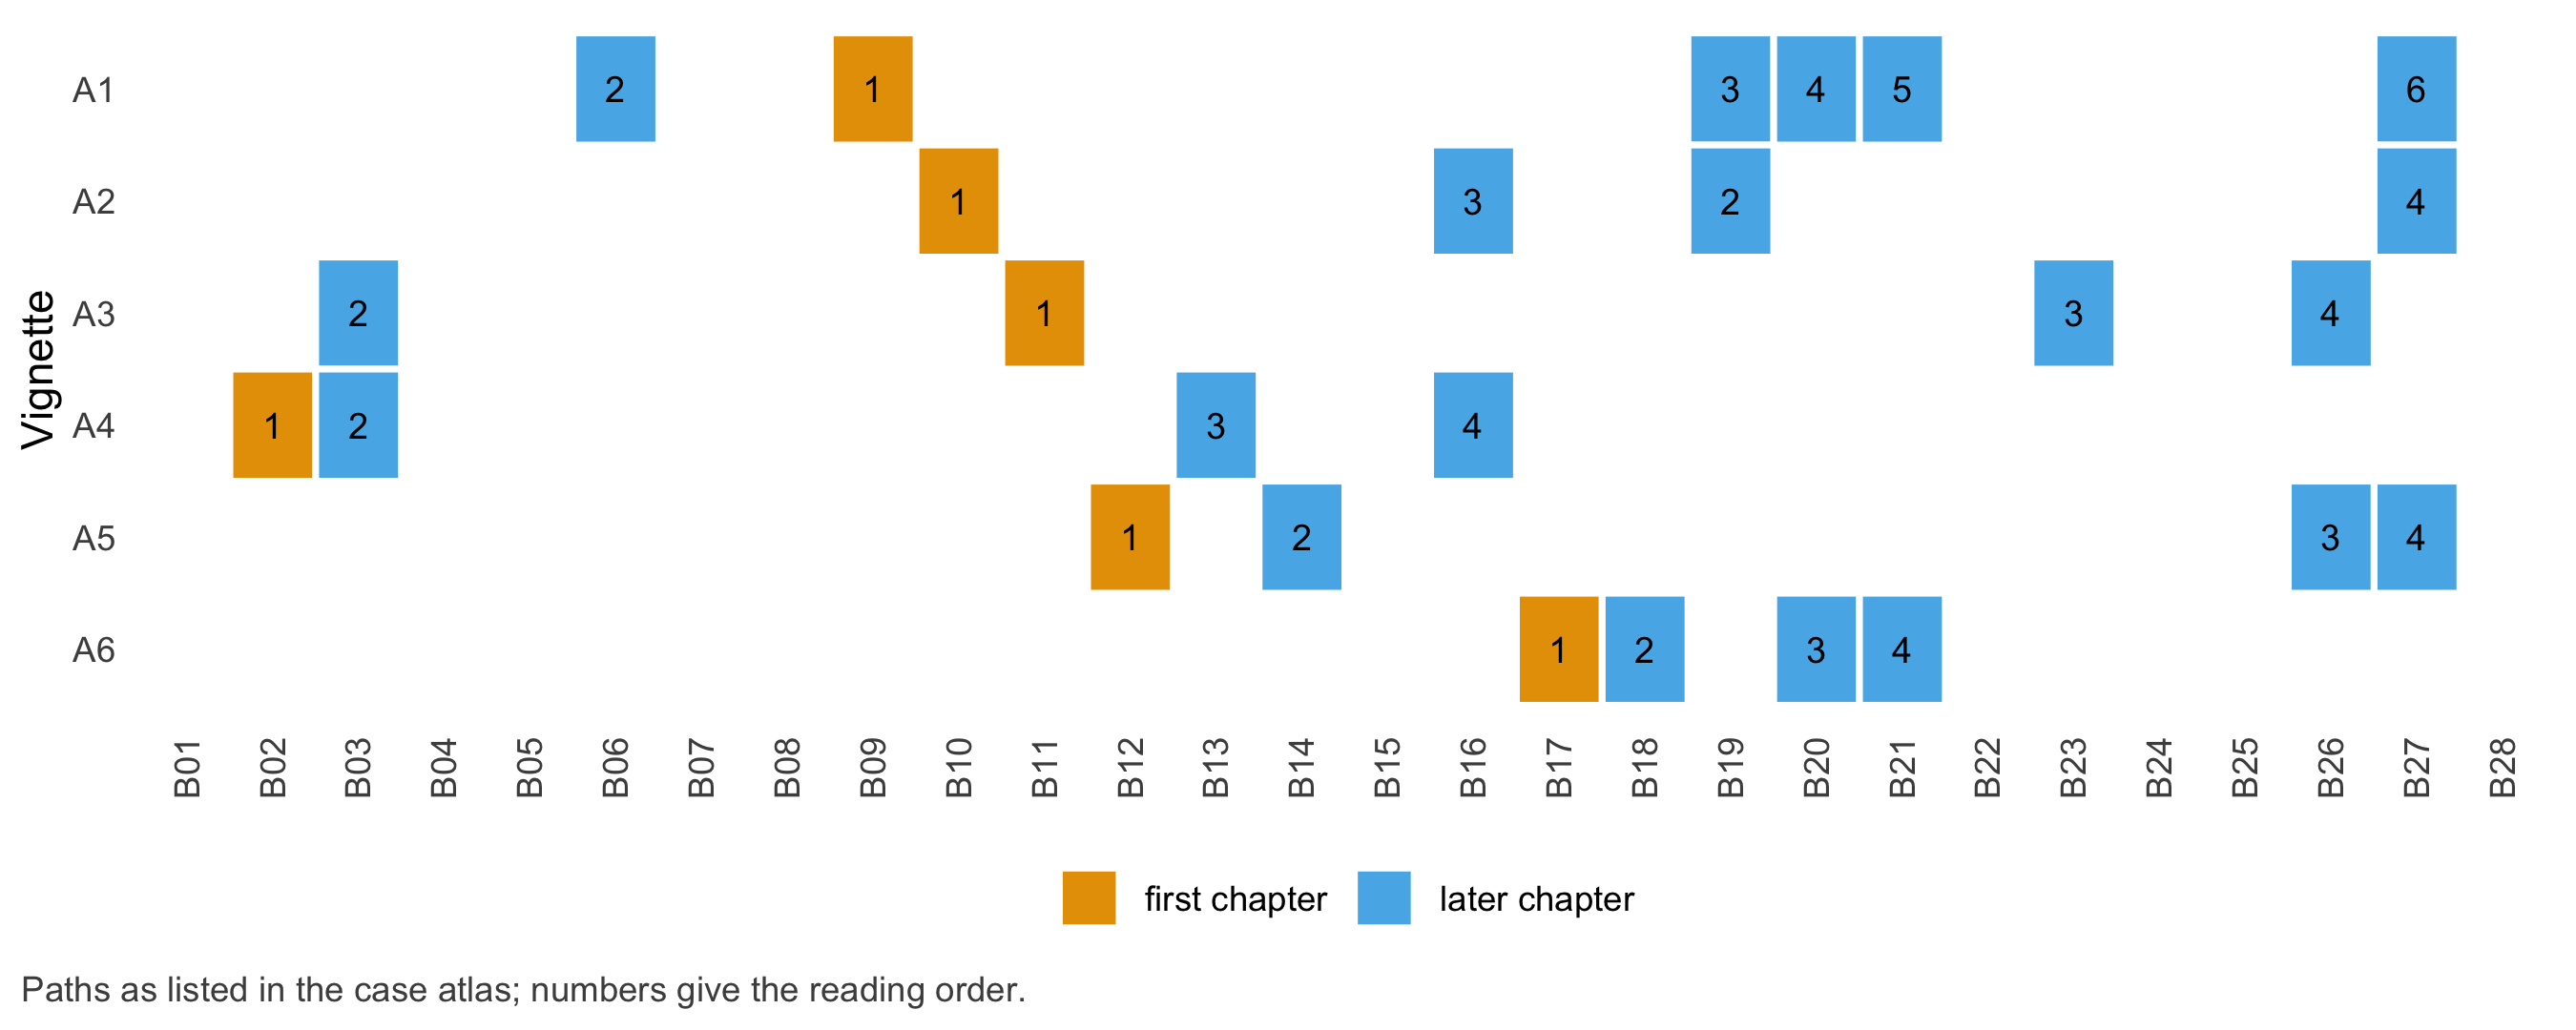
28.4 Counter-check
The path of a vignette is not fixed by its data. It changes when the target statement changes. The function below adds chapters to a path when the target population moves from animals to patients, and when a research result is meant to be used in care. Before running it, predict which chapters vignette A2 (wound perfusion in a pig model) gains if its target statement becomes “patients with soft-tissue wounds in a supervised clinical pilot”.
extend_path <- function(v, population, deployment) {
  a <- atlas[[v]]
  extra <- character(0)
  if (a$population == "animals" && population == "patients")
    extra <- c(extra, "b19", "b21", "b23")            # species transfer, ethics, personal data
  if (deployment && !a$deployment)
    extra <- c(extra, "b22", "b20", "b24", "b25")     # purpose, pilot, security
  unique(c(a$path, extra))
}
a2_moved <- extend_path("A2", population = "patients", deployment = TRUE)
setdiff(a2_moved, atlas$A2$path)
#> [1] "b21" "b23" "b22" "b20" "b24" "b25"stopifnot(all(c("b21", "b22", "b23", "b20") %in% a2_moved),
length(setdiff(a2_moved, atlas$A2$path)) == 6)The pig study gains six chapters: ethics with patients, regulation, data protection, the pilot and both security chapters. Species transfer (Chapter 19) was already on the path, now with a harder question – not new animals, but a new species. The data type did not change at all. This is the key assumption of the chapter in one line of code.
28.5 Consequences for patients and operations
Patients. A wrong route costs time, but a route that skips a risk costs more. The most frequent failure is to treat a project as purely technical: the gait group that never asks where the raw video goes, the laboratory that never asks what a result per spectrum means for the next animals. The risk route exists to make these questions visible before anyone is affected.
Responsibility. The atlas does not replace the people who carry responsibility: the statistician for the analysis plan, the data protection officer for the data flow, the ethics committee and the animal welfare body for the study, the regulatory function for the intended purpose, and the clinical lead for the decision to use a tool. Every vignette therefore ends with a decision that a named role must take (Chapter 27).
Regulation, data protection and security. These topics enter a path through the risk route and through the counter-check above. A vignette that stays in research has fewer of them; the moment a result is meant to change care, Chapter 22 to Chapter 25 join the path.
Keeping the atlas current. Chapter numbers are stable identifiers, but legal dates, guidelines and sister-book anchors change. The edition notes record the state of each edition; the Lab of this chapter is the first test to rerun after any change to the chapter list.
28.6 Look up and transfer
Reviewer question: For a project you are asked to review, which row of the risk navigator would you open first, and does the project’s own documentation answer the question of that row?
Self-test: A pharmacy team asks whether a forecast of antibiotic consumption on the trauma wards can be used to order stock two weeks ahead, and whether a dashboard could later suggest switching patients to oral treatment. Which vignette is nearest, which part of the request changes the path, and which chapters join it?
TipAnswer
The nearest vignette is A6: a forecast of demand with a planning decision (Chapter 17), checked by a rolling-origin backtest against a seasonal naive baseline. The first request stays in that path. The second request is different in kind: suggesting a treatment change for individual patients makes the dashboard a decision aid about patients. That part of the request brings in Chapter 22 (intended purpose and possible medical device status), Chapter 23 (patient-level data flow), Chapter 21 (who bears the harm of a wrong suggestion) and, before any use, Chapter 20 (pilot and stop criterion). The two requests should become two projects with two passports.
28.6.1 Case atlas
The six vignettes are new cases, not repeats of the chapter examples. All institutions, numbers and data are fictitious; where a number would be needed, it is marked open.
28.6.1.1 A1 · A second look at the wrist
A hand-surgery outpatient clinic considers an alert, evaluated in a large emergency department, that flags possible scaphoid fractures on wrist radiographs. Many of its patients were referred after negative imaging elsewhere.
- Decision: should an alert trigger a second read by a hand surgeon, and who follows up a missed fracture?
- Data and unit: one radiograph examination per patient and episode; reference standard: follow-up imaging.
- First baseline: current practice, a second read only on clinical suspicion.
- Main risk: prevalence and case mix differ from the evaluation site, so predictive values do not transfer; alert fatigue.
- First observable test: recompute the 2 × 2 table at the clinic’s prevalence (open: local prevalence), then a pilot in shadow mode with a stop criterion.
- Chapter path: Chapter 9 → Chapter 6 → Chapter 19 → Chapter 20 → Chapter 21 → Chapter 27
- Workshops: W3 · Diagnostics, prediction and evidence · W8 · Colloquium and decision
- Look further: CTTIR Courses: Diagnostic testing – Se, Sp, PPV, NPV, LR
28.6.1.2 A2 · Perfusion in soft-tissue wounds
A translational group records hyperspectral images of experimental soft-tissue wounds in a fictitious pig model: several images per wound, two wounds per animal, three time points.
- Decision: is a confirmatory experiment justified, and with how many animals?
- Data and unit: spectra nested in images, wounds and animals; the independent unit is the animal.
- First baseline: a simple spectral index with a threshold fixed in advance.
- Main risk: leakage between images of the same animal; illumination differences between sessions.
- First observable test: split by animal with an ID overlap of zero; counter-check with a changed illumination reference.
- Chapter path: Chapter 10 → Chapter 19 → Chapter 16 → Chapter 27
- Workshops: W4 · Imaging, gait and tissue · W8 · Colloquium and decision
- Look further: Methods in R: ARRIVE – animal research
28.6.1.3 A3 · Walking again after an ankle fracture
A rehabilitation team films patients walking along the corridor with a tablet; software estimates the knee angle.
- Decision: can the tablet angle replace the laboratory measurement for the discharge assessment?
- Data and unit: many steps per patient, two methods; the independent unit is the patient.
- First baseline: the laboratory measurement as reference; a tolerance fixed clinically in advance.
- Main risk: camera angle and occlusion; raw video that identifies patients and is kept longer than needed.
- First observable test: difference plot per patient against the tolerance; a data flow with a deletion point for the raw video.
- Chapter path: Chapter 11 → Chapter 3 → Chapter 23 → Chapter 26
- Workshops: W4 · Imaging, gait and tissue · W5 · Causality, trajectories and phenotypes
- Look further: CTTIR Courses: Kappa, ICC, Bland–Altman
28.6.1.4 A4 · A serum marker after spinal cord injury
A fictitious cohort has a serum marker measured at irregular times over twelve weeks after spinal cord injury. Patients in the worst condition are transferred or die earlier and contribute fewer measurements.
- Decision: should the early slope of the marker enter the protocol of a prognostic study?
- Data and unit: repeated measurements per patient; time zero is the injury.
- First baseline: a per-patient summary (change from the first measurement) next to a mixed model.
- Main risk: informative dropout; selection through intensive care admission.
- First observable test: sensitivity analysis for late measurements; a DAG for the selection step.
- Chapter path: Chapter 2 → Chapter 3 → Chapter 13 → Chapter 16
- Workshops: W5 · Causality, trajectories and phenotypes
- Look further: CTTIR Courses: Linear mixed models with lme4
28.6.1.5 A5 · Cell types in a fracture callus
Multiplex-stained sections from fictitious fracture callus biopsies are segmented, and the resulting clusters are labelled as new cell subtypes for a grant proposal.
- Decision: may the subtype label appear in the proposal as a finding?
- Data and unit: cells within sections within patients; the independent unit is the patient.
- First baseline: marker thresholds set by an expert (manual gating).
- Main risk: segmentation boundary, batch effects between staining runs, clusters produced by scaling; rare marker combinations in shared images.
- First observable test: shift the segmentation boundary and repeat the clustering on bootstrap samples; summarise per patient.
- Chapter path: Chapter 12 → Chapter 14 → Chapter 26 → Chapter 27
- Workshops: W4 · Imaging, gait and tissue · W5 · Causality, trajectories and phenotypes
- Look further: CTTIR Courses: Clustering – k-means, hierarchical, model-based
28.6.1.6 A6 · Weekend peaks in the trauma theatre
A fictitious trauma service sees more emergency operations at weekends. Management asks whether a second weekend team would shorten the wait for hip fracture surgery.
- Decision: staff a second weekend team or not.
- Data and unit: daily arrivals for the forecast; waiting time per patient for the simulation.
- First baseline: a seasonal naive forecast; the current one-team scenario.
- Main risk: using a forecast to answer a capacity question; longer waits shifted onto lower-priority patients.
- First observable test: rolling-origin backtest of arrivals; both scenarios simulated on identical arrival streams, with the spread across runs.
- Chapter path: Chapter 17 → Chapter 18 → Chapter 20 → Chapter 21
- Workshops: W6 · Pharmacometrics, forecasting and simulation · W8 · Colloquium and decision
- Look further: Methods in R: Rolling-origin cross-validation
28.6.2 Formative model answers
Try your own brief first. Each answer names the target statement, the first test with its expected result and the decision that a named role has to take.
TipModel answer A1
Target statement: “In patients referred to this clinic after a wrist injury, an alert-triggered second read finds scaphoid fractures that would otherwise be missed, at an acceptable number of extra reads.” First test: the 2 × 2 table at the local prevalence, with the number of alerts per week as the workload measure. Expected result: a lower positive predictive value than at the evaluation site if the local prevalence is lower – this alone is not a reason to reject the tool. Decision: the clinic lead approves a shadow pilot and names who may stop it (Chapter 20, Chapter 27).
TipModel answer A2
Target statement: “In new pigs of the same strain, the index separates well from poorly perfused wound tissue.” First test: split by animal, ID overlap zero, result reported per animal with its interval. Expected result: a wide interval with few animals; the passport then states which sample size the next experiment needs, justified with Chapter 16. Decision: the principal investigator, with the animal welfare officer, decides whether the confirmatory experiment is justified under the 3Rs.
TipModel answer A3
Target statement: “For patients after ankle fracture, the tablet angle agrees with the laboratory angle within the clinical tolerance.” First test: limits of agreement from per-patient means, compared with the tolerance fixed in advance. Expected result: either agreement within tolerance or a systematic offset that depends on camera position. Decision: the rehabilitation lead decides on use; the data protection officer approves the data flow and the deletion point for raw video (Chapter 23).
TipModel answer A4
Target statement: “In patients after spinal cord injury, the marker slope over the first weeks is associated with the later outcome.” First test: mixed model against per-patient summaries, plus an analysis that assumes worse values for patients who drop out. Expected result: if the slope changes materially under this assumption, the protocol must plan for dropout. Decision: the study steering group decides whether the marker enters the protocol as a candidate, not as a proven predictor.
TipModel answer A5
Target statement: “Across patients, a cell population with this marker profile is reproducibly present in fracture callus.” First test: clustering repeated after shifting the segmentation boundary and on bootstrap samples, summarised per patient. Expected result: a stable population is found again; an unstable one is reported as a hypothesis. Decision: the principal investigator words the proposal accordingly; shared images are checked for rare combinations before release (Chapter 26).
TipModel answer A6
Target statement: “Under the stated arrival assumptions, a second weekend team reduces the waiting time for hip fracture surgery by an amount that justifies its cost.” First test: forecast checked by backtest; both scenarios simulated on identical arrival streams with the spread over runs. Expected result: a difference with a range, plus the effect on lower-priority patients. Decision: the hospital management decides on staffing; the simulation report names its assumptions (STRESS, Chapter 27).
28.6.4 Glossary (English–German)
The glossary lists 95 terms with their German equivalent and the chapter in which each is introduced. Statistical terms that this book uses without defining them are explained in the glossaries of the sister books: Methods in R, Scientometrics in R, Strategy in R and CTTIR Courses.
| Term | German | Introduced in |
|---|---|---|
| 3Rs (replacement, reduction, refinement) | 3R (Vermeidung, Verminderung, Verbesserung) | Chapter 16 |
| Agent-based simulation | agentenbasierte Simulation | Chapter 18 |
| Alert fatigue | Alarmmüdigkeit | Chapter 20 |
| Anonymisation | Anonymisierung | Chapter 23 |
| Area under the ROC curve (AUC) | Fläche unter der ROC-Kurve | Chapter 6 |
| Baseline model | Vergleichsmodell, Basismodell | Chapter 5 |
| Batch effect | Batch-Effekt, Chargeneffekt | Chapter 12 |
| Bland–Altman plot | Differenzdiagramm nach Bland und Altman | Chapter 11 |
| Calibration | Kalibrierung | Chapter 6 |
| Case mix | Fallmix | Chapter 19 |
| Checksum (hash) | Prüfsumme (Hashwert) | Chapter 25 |
| Clearance | Clearance | Chapter 15 |
| Cluster stability | Clusterstabilität | Chapter 14 |
| Collider | Collider (gemeinsame Folge zweier Variablen) | Chapter 2 |
| Confounder | Confounder, Störgröße | Chapter 2 |
| Controlled access | kontrollierter Zugang | Chapter 26 |
| Data dictionary | Datenwörterbuch | Chapter 3 |
| Data leakage | Datenleck zwischen Training und Test | Chapter 19 |
| Data minimisation | Datenminimierung | Chapter 23 |
| Data permit | Datengenehmigung | Chapter 26 |
| Data poisoning | Datenvergiftung | Chapter 25 |
| Data protection impact assessment (DPIA) | Datenschutz-Folgenabschätzung (DSFA) | Chapter 23 |
| Decision sheet | Entscheidungsblatt | Chapter 27 |
| Decision threshold | Entscheidungsschwelle | Chapter 6 |
| Denominator | Nenner | Chapter 3 |
| Directed acyclic graph (DAG) | gerichteter azyklischer Graph | Chapter 2 |
| Discrete-event simulation | ereignisdiskrete Simulation | Chapter 18 |
| Distribution shift, drift | Verteilungsverschiebung, Drift | Chapter 20 |
| Equivalence class | Äquivalenzklasse | Chapter 26 |
| Estimand | Estimand, Schätzziel | Chapter 2 |
| Excessive agency | übermäßige Handlungsbefugnis | Chapter 25 |
| External validation | externe Validierung | Chapter 19 |
| Fabricated reference | erfundene Quellenangabe | Chapter 8 |
| Fallback procedure | Rückfallverfahren | Chapter 20 |
| False positive | falsch positiver Befund | Chapter 9 |
| Grouped split (split by individual) | gruppierte Aufteilung (nach Individuum) | Chapter 19 |
| Health data access body | Zugangsstelle für Gesundheitsdaten | Chapter 26 |
| High-risk AI system | Hochrisiko-KI-System | Chapter 22 |
| Human-in-the-loop | Mensch in der Entscheidungsschleife | Chapter 20 |
| Hyperspectral cube | hyperspektraler Datenwürfel | Chapter 10 |
| Identifiability (of parameters) | Identifizierbarkeit (von Parametern) | Chapter 15 |
| Indirect prompt injection | indirekte Prompt-Injection | Chapter 25 |
| Informative dropout | informativer Ausfall | Chapter 13 |
| Intended purpose | Zweckbestimmung | Chapter 22 |
| k-anonymity | k-Anonymität | Chapter 26 |
| Least privilege | Prinzip der minimalen Rechte | Chapter 24 |
| Limits of agreement | Übereinstimmungsgrenzen | Chapter 11 |
| Long format | Langformat | Chapter 4 |
| Membership inference | Rückschluss auf die Trainingsmitgliedschaft | Chapter 25 |
| Missing at random (MAR) | zufällig fehlend | Chapter 3 |
| Missing not at random (MNAR) | nicht zufällig fehlend | Chapter 3 |
| Mixed model, random slope | gemischtes Modell, zufällige Steigung | Chapter 13 |
| Model passport | Modellpass | Chapter 27 |
| Neighbourhood analysis | Nachbarschaftsanalyse | Chapter 12 |
| Nested cross-validation | verschachtelte Kreuzvalidierung | Chapter 5 |
| Occlusion | Verdeckung | Chapter 11 |
| Personal data breach | Verletzung des Schutzes personenbezogener Daten | Chapter 23 |
| Positive predictive value (PPV) | positiver Vorhersagewert | Chapter 9 |
| Posterior distribution | A-posteriori-Verteilung | Chapter 16 |
| Prediction interval | Prognoseintervall | Chapter 17 |
| Prevalence | Prävalenz | Chapter 9 |
| Prior distribution | A-priori-Verteilung | Chapter 16 |
| Pseudonymisation | Pseudonymisierung | Chapter 23 |
| Pseudoreplication | Pseudoreplikation | Chapter 3 |
| Purpose limitation | Zweckbindung | Chapter 26 |
| Quasi-identifier | Quasi-Identifikator | Chapter 26 |
| Re-identification | Reidentifizierung | Chapter 26 |
| Reader study | Reader-Studie (Befunderstudie) | Chapter 7 |
| Recovery | Wiederanlauf, Wiederherstellung | Chapter 24 |
| Reference standard | Referenzstandard | Chapter 7 |
| Regularisation (elastic net) | Regularisierung (Elastic Net) | Chapter 5 |
| Reporting guideline | Berichtsleitlinie | Chapter 27 |
| Reproducible project | reproduzierbares Projekt | Chapter 4 |
| Retrieval-augmented generation | abrufgestützte Generierung | Chapter 8 |
| Rolling-origin evaluation (backtest) | rollierende Prognoseprüfung | Chapter 17 |
| Secondary use | Sekundärnutzung | Chapter 26 |
| Secure processing environment | sichere Verarbeitungsumgebung | Chapter 26 |
| Segmentation | Segmentierung | Chapter 12 |
| Sensitivity | Sensitivität | Chapter 6 |
| Shadow mode | Schattenbetrieb | Chapter 20 |
| Specificity | Spezifität | Chapter 6 |
| Synthetic data | synthetische Daten | Chapter 26 |
| Target population | Zielpopulation | Chapter 1 |
| Target statement | Zielaussage | Chapter 27 |
| Teach-back | Teach-back-Methode (Rückversicherung durch Nacherzählen) | Chapter 21 |
| Temperature (language model) | Temperatur (Sprachmodell) | Chapter 8 |
| Threat model | Bedrohungsmodell | Chapter 24 |
| Time zero | Zeitnull | Chapter 2 |
| Token | Token | Chapter 8 |
| Translational chain | translationale Kette | Chapter 1 |
| Trust boundary | Vertrauensgrenze | Chapter 25 |
| UMAP island | UMAP-Insel | Chapter 14 |
| Unit of analysis | Analyseeinheit, unabhängige Einheit | Chapter 3 |
| Volume of distribution | Verteilungsvolumen | Chapter 15 |
| White and dark reference | Weiß- und Dunkelreferenz | Chapter 10 |
28.6.5 Register of common mistakes
The register lists mistakes in reasoning and design, each with a warning sign and a check. Errors in software and builds (packages, Quarto, renv, Git) are collected in Methods in R: Common errors and CTTIR Courses: Common errors. Four publications show how widespread some of these mistakes are: leakage in machine-learning-based science (Kapoor and Narayanan 2023), the wrong experimental unit in animal studies, where about half of the surveyed studies showed pseudoreplication (published, Lazic et al. 2018), neglected calibration (Van Calster et al. 2019), and methodological flaws that left none of 62 reviewed imaging models fit for clinical use (published, Roberts et al. 2021).
| Mistake | Warning sign | Check | Chapters |
|---|---|---|---|
| Accuracy per image or spectrum, claim about individuals | n in the abstract exceeds the number of animals or patients | ID overlap between training and test; result per individual | Chapter 19, Chapter 27 |
| Repeated measurements counted as independent | narrow intervals from many measurements of few individuals | name the experimental unit before the analysis | Chapter 3, Chapter 16 |
| Predictive values carried into another setting | same PPV quoted for a different prevalence | recompute the 2 × 2 table at the local prevalence | Chapter 9 |
| Good ranking read as good calibration | only the AUC is reported | calibration plot, observed against expected | Chapter 6 |
| Tuning or preprocessing on all data | test performance better than plausible | nested validation; preprocessing inside the folds | Chapter 5 |
| Adjusting for a collider | association appears after restricting to admitted patients | draw the DAG before modelling | Chapter 2 |
| Clusters read as subtypes | clusters change with scaling, seed or segmentation | stability check and alternative scaling | Chapter 14, Chapter 12 |
| Unit error in a mechanistic model | implausible clearance or volume | units carried through; analytic solution as check | Chapter 15 |
| Forecast interval read as a guarantee | coverage never checked on later data | rolling-origin backtest with coverage | Chapter 17 |
| Unverified simulation | no trace of single entities, different input streams per scenario | event log of one entity; identical arrival streams | Chapter 18 |
| Pilot without a stop criterion | no denominator, no named person, no date | monitoring plan with escalation and stop rule | Chapter 20, Chapter 27 |
| Research label taken as legal basis | no documented legal basis for the change of purpose | legal basis per purpose; data protection officer | Chapter 23, Chapter 26 |
| Pseudonymised data taken as anonymous | key exists; rare combinations in the release | k-anonymity check; assessment per recipient | Chapter 26 |
| Trusting the model to ignore embedded instructions | assistant can act on document content | permission tests with synthetic documents | Chapter 25 |
| Version label trusted instead of checksum | same version, different behaviour | compare checksum with the release record | Chapter 24, Chapter 25 |
| Fabricated or misattributed citation | reference not found or passage does not support the claim | check DOI, title and the cited passage | Chapter 8 |
| Use drifts beyond the intended purpose | tool used for decisions it was not meant for | compare actual use with the stated purpose | Chapter 22 |
| Speed claim without benchmark | one language is called faster | benchmark on identical inputs and tolerance | Chapter 15 |
28.6.6 The next experiment on one page
Every project ends with a next step, and the next step is best written down before the colloquium. The sketch below fits on one page. The right-hand column shows it filled in for vignette A2; the same form works for a security test, for example a rerun of the control matrix of Chapter 25 after a model update.
| Field | Next validation experiment for A2 (example) |
|---|---|
| Target statement | Spectral index separates well from poorly perfused wound tissue in new pigs of the same strain |
| What would change the decision | Agreement per animal above the threshold fixed in advance → confirmatory study; below → stop and revise the index |
| Design | New animals only; split by animal; same device, protocol and illumination reference as before |
| Independent unit and n | Animal; n justified in advance with a prior from the pilot (Chapter 16) – open until calculated |
| Baseline and comparator | The fixed index from the pilot; the reference rule of Chapter 27 as a floor |
| Primary measure with denominator | Correct classification per animal, with exact interval |
| Counter-check | Changed illumination reference in a subset of sessions |
| Pre-registration and stop criterion | Analysis plan filed before the first animal; stop if the interim check shows the index fails in both classes |
| Roles | Principal investigator (decision), statistician (analysis plan), animal welfare officer (3Rs) |
| Risks and controls | Ethics: animal numbers; data: checksum of the analysis script; no personal data |
| Review date | After the analysis plan is approved; date set by the principal investigator |
Annotated sources
- Kapoor and Narayanan (2023) – survey of data leakage across 17 fields of machine-learning-based science, with a taxonomy of eight leakage types; background for the first row of the register.
- Lazic et al. (2018) – survey of animal experiments showing how often the experimental unit is chosen wrongly.
- Van Calster et al. (2019) – why calibration, not only discrimination, decides whether predictions can be used.
- Roberts et al. (2021) – systematic review of imaging models with a list of recurring methodological pitfalls.
28.7 Further reading
- Chapter 27 – the passport and decision sheet that turn an atlas vignette into a project record.
- Chapter 1 – the decision map with addressee, action and fallback, the starting point of every vignette.
- Methods in R: Find your method – flowchart and quick lookup from research question to statistical test.
- Methods in R: Glossary – definitions of statistical terms used throughout this book.
- CTTIR Courses: Decision tree – a branching guide from question to lab.
- CTTIR Tutorials: Decision Tree – interactive assistant and printable chart for choosing a test.
- CTTIR Courses: Glossary and Common errors – plain-English definitions and fixes for frequent R and Quarto errors.
- CTTIR Courses: Writing a report – how an analysis becomes a document a reviewer will trust.